Parsware Platform
A dashboard on a screen
An Overview screen for the Contact list app: three tiles that each count contacts with one query, a donut of where they are, and the Contact table's own grid underneath. The tiles are drawn boxes, the chart and the grid are the platform's own.
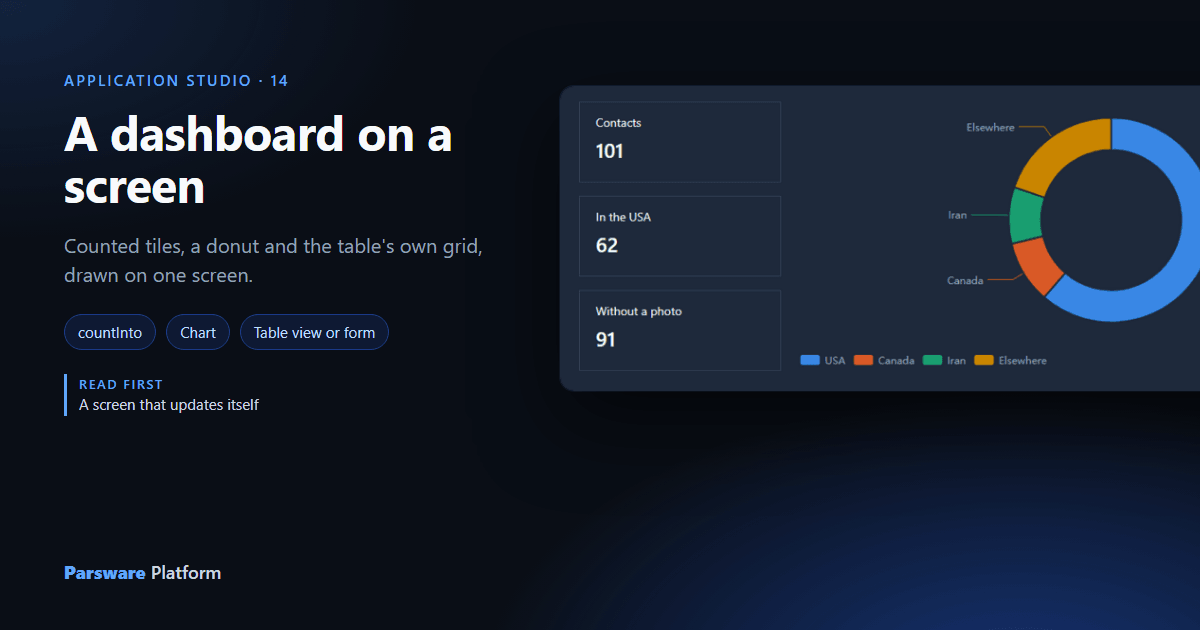
A dashboard is a few numbers, a chart or two, and a list to dig into. On a drawn screen, each of those is something you already know: a number is a query that counts, a chart is a control bound to a list, and the list is the table's own grid, placed on the screen.
This article adds an Overview screen to the Contact list app from the last article.
1. A screen, and a field per number
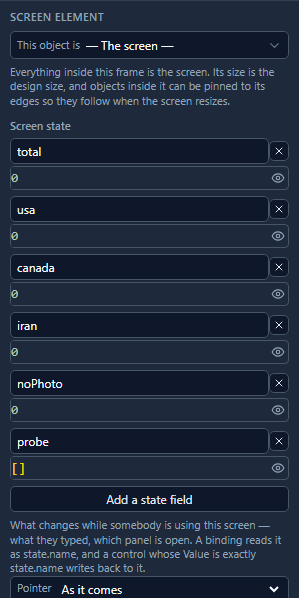
Draw a frame 1200 by 760 below the other two, name it Overview, and in the Screen tab set
This object is to — The screen —. Then add its state: one field per number, all 0, and one
called probe set to []:
2. Count, don't fetch
Every number is one loadRecords, in the screen's Screen opens handler:
loadRecords("contact", "probe", { top: 1, countInto: "total" });
loadRecords("contact", "probe", { top: 1, where: { address1_country: "USA" }, countInto: "usa" });
loadRecords("contact", "probe", { top: 1, where: { address1_country: "Canada" }, countInto: "canada" });
loadRecords("contact", "probe", { top: 1, where: { address1_country: "Iran" }, countInto: "iran" });
loadRecords("contact", "probe", { top: 1, empty: ["new_photo"], countInto: "noPhoto" });
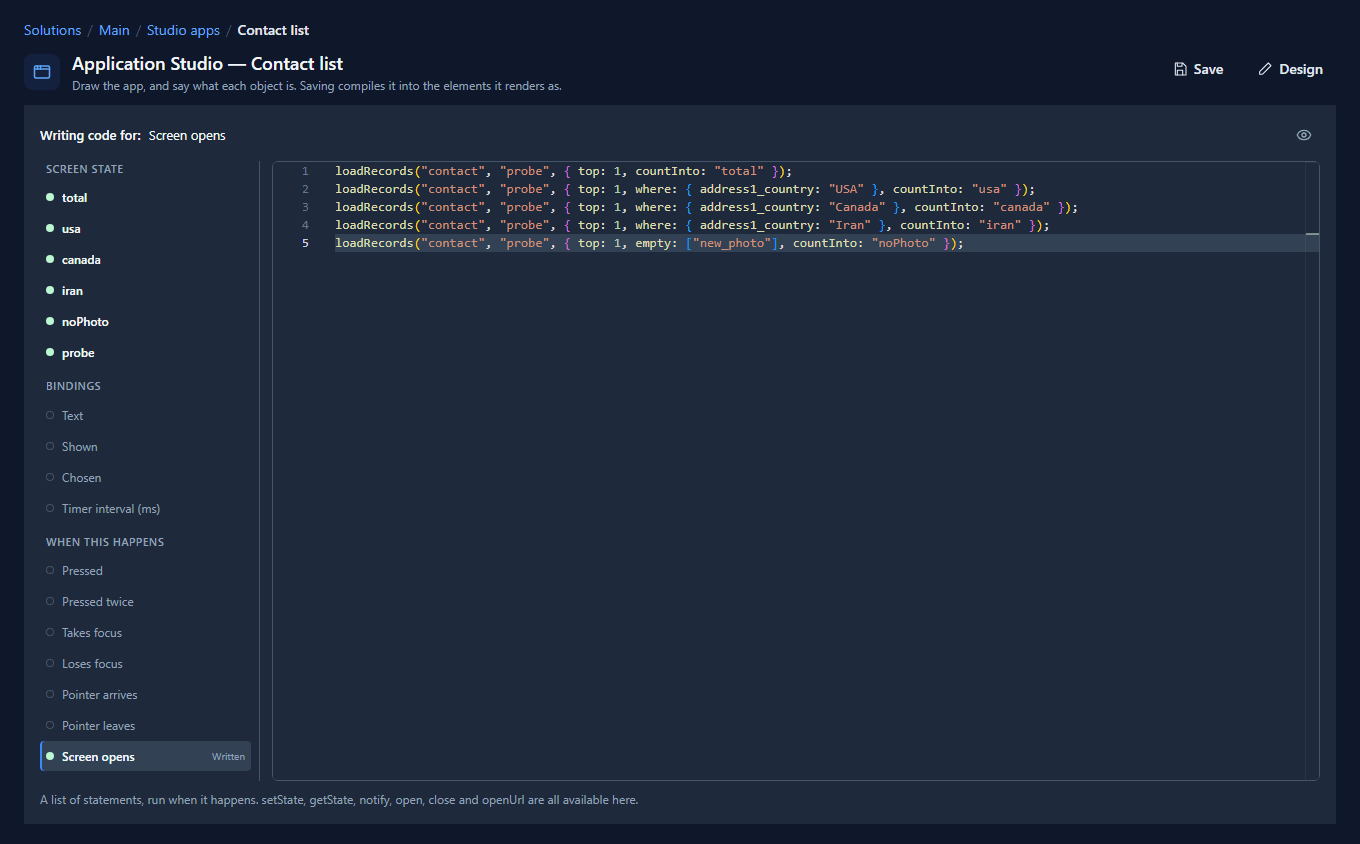
countInto is where how many rows match goes, not how many came back. top: 1 keeps the page
that does come back as small as a page can be, into probe, which nothing reads. So each number is
counted where the data is, and the screen never holds 101 contacts to count them.
where matches values exactly. empty is its opposite: a list of fields that must have nothing in
them, so the last line counts the contacts without a photo.
3. The tiles
A tile is three things you draw: a frame 240 by 96, a paragraph with what it counts, and a heading for the number. Bind the heading's Text:
format(state.total, "integer")
format writes the number the way the reader's language does, with thousands separators, and in
Persian digits in a Persian session. Draw two more for usa and noPhoto.
4. The chart
From Controls, click Chart, make it 752 by 320, and in the Screen tab set Chart to Donut. Write Contacts by country inside it: the words inside a chart are what a screen reader announces, rather than just "graphic".
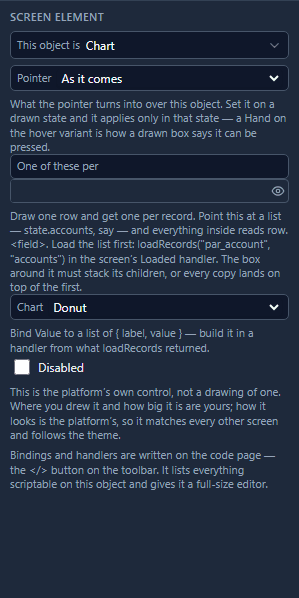
Its Value is a list of slices, each a label and a value:
[
  { label: "USA", value: state.usa },
  { label: "Canada", value: state.canada },
  { label: "Iran", value: state.iran },
  { label: "Elsewhere", value: state.total - state.usa - state.canada - state.iran }
]
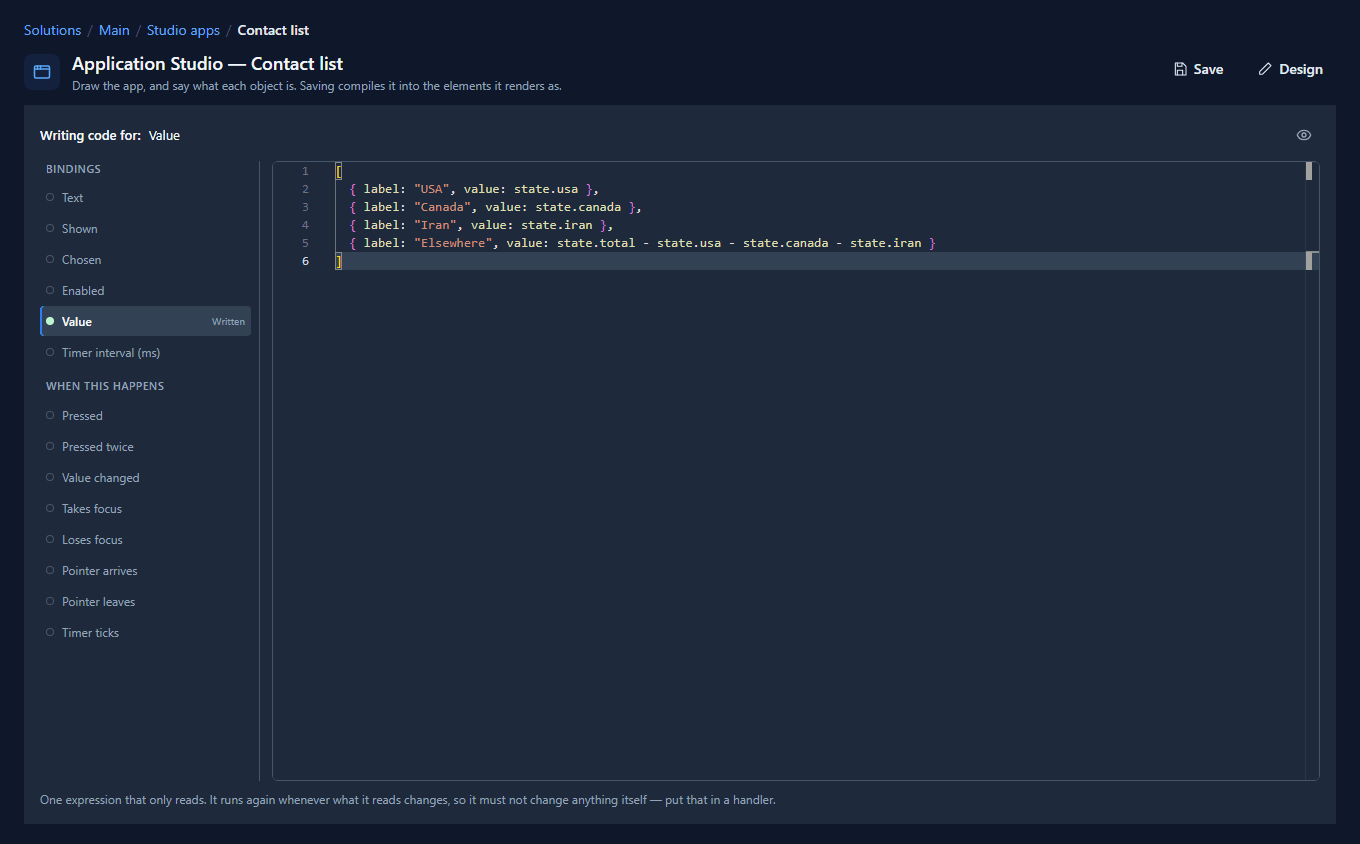
Elsewhere is worked out from the others, so the slices always add up to every contact. Bars, a line, an area or a pie take the same list. The chart is the platform's own, so placing the labels, the legend and the tooltips is its job, not yours.
5. The table's own grid
From Controls, click Table view or form and stretch it across the bottom, 1008 by 280. In the
Screen tab, Shows is A view's rows, and Table is contact:
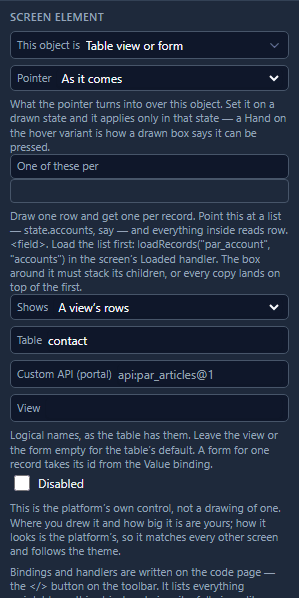
Leave View empty for the table's default view, or type a view's logical name. What appears is the same grid a model-driven app shows, with its sorting, its paging, its column chooser and its record pictures. Nothing about it is redrawn.
Last, a link back: All contacts, with the address /apps/new_contactlist/Contacts, and one on the
Contacts screen pointing here (see Links).
6. Open it
Save, and follow the Overview link in the Shell:
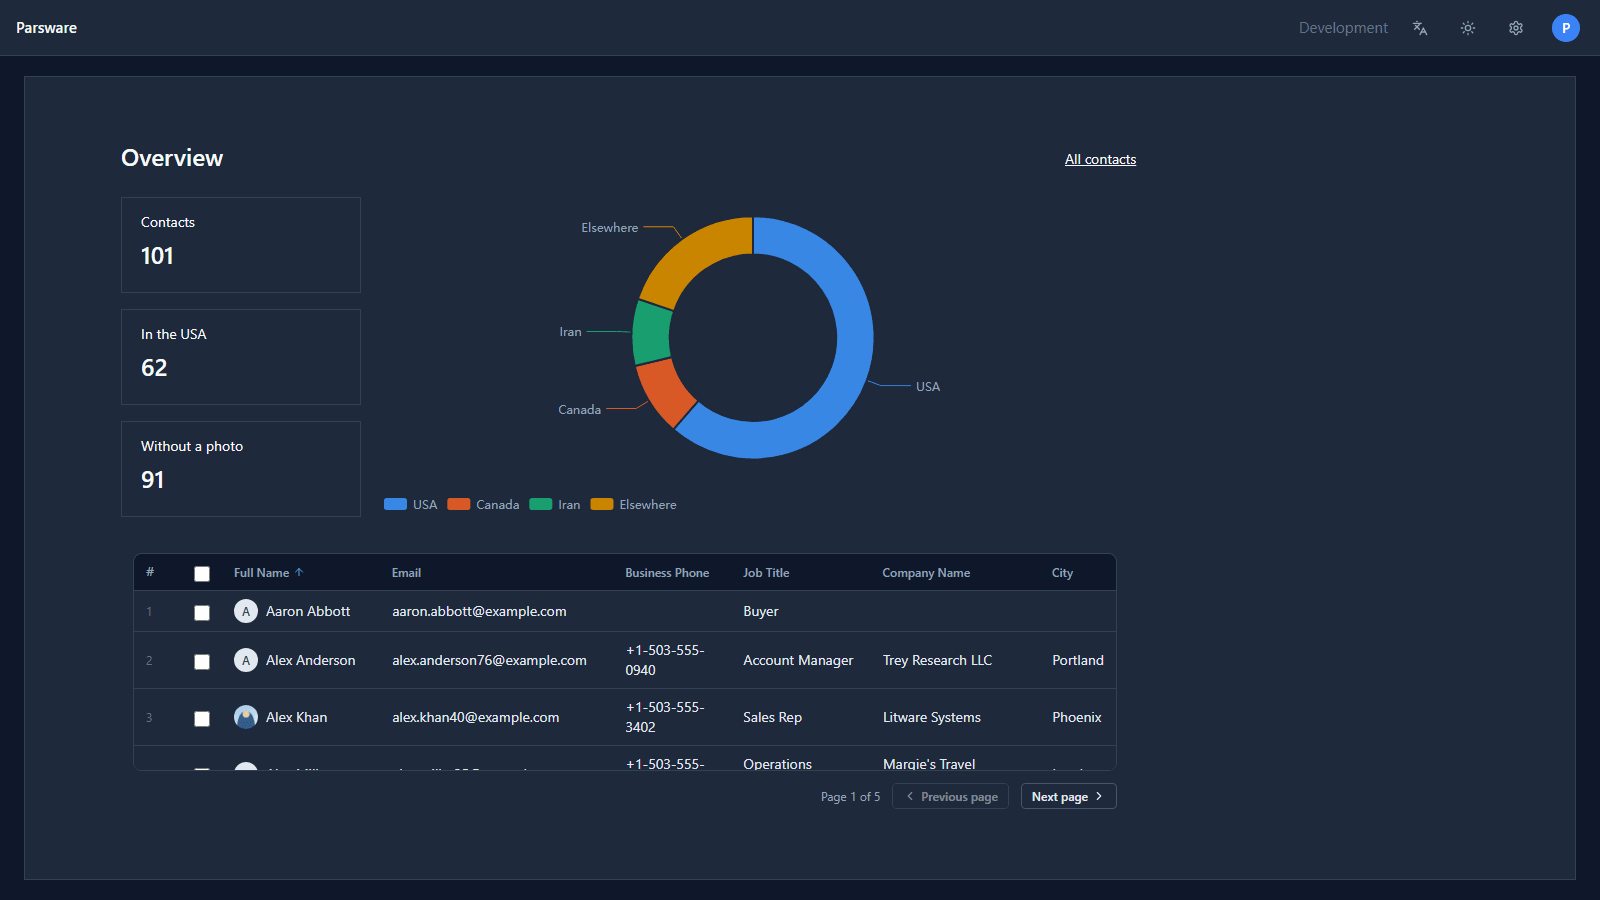
The numbers are counted when the screen opens. To keep them fresh, run the same five lines in a
Refresh button's handler, or on a timer (see
A screen that updates itself). The grid keeps its own query,
so end that handler with reloadSurfaces() to fetch it again too.
What we fixed
Building this turned up a bug, now fixed:
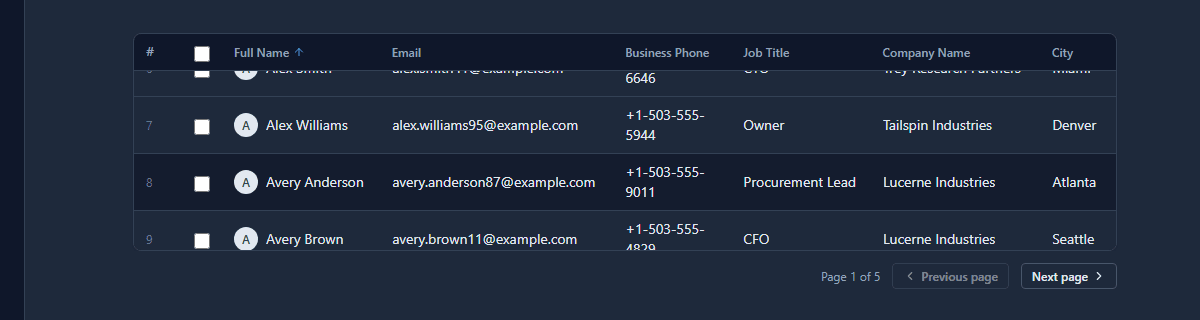
- A grid's column names scrolled away with its rows. Every grid's header row is meant to stay put while the rows scroll under it. It didn't, here or on a full-page list: the platform's table style clipped each table in a way that made the table its own scroll box, so the header stuck to a table that never scrolled. Tables are clipped differently now, and the header stays:
Try it
Import the Support overview sample (studio-dashboard). It has its own table, a button that adds
24 tickets, four tiles, a bar chart and a donut, the grid, and the table's quick create form on the
same screen.
Next: a process's tasks shown on a drawn screen.