A team leaderboard
Who has submitted the most expenses, as a bar chart. Each bar is one count asked of Dataverse, not rows added up on the page.
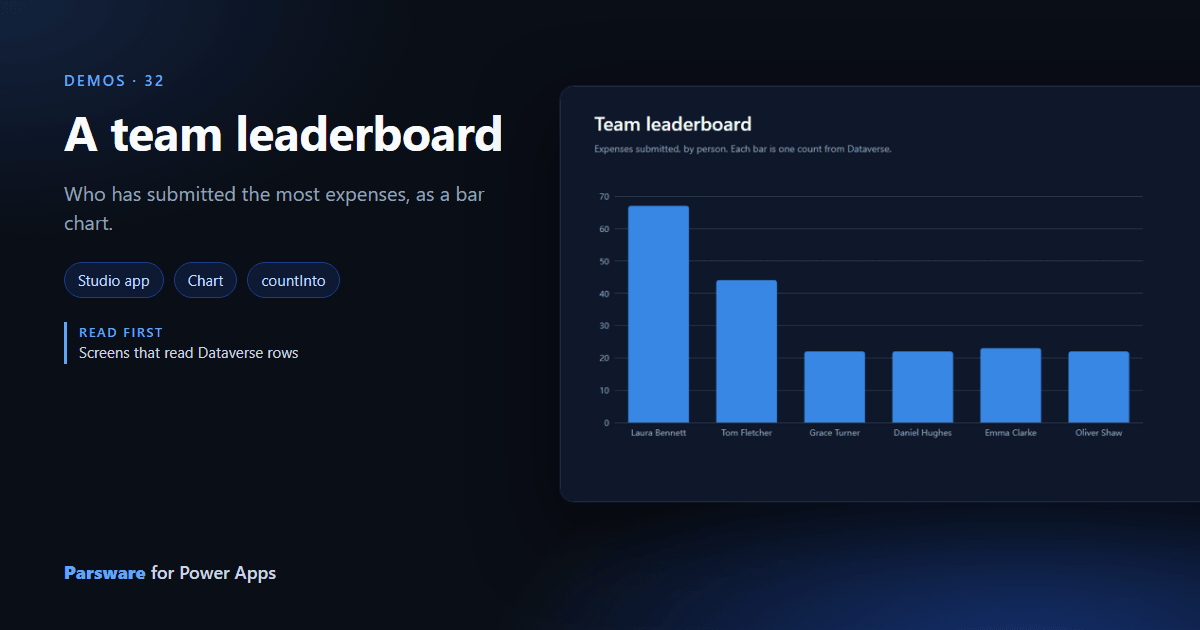
Who has submitted the most expenses? A view sorted by person makes you count. This demo draws the answer as a chart: Demos → Team leaderboard.
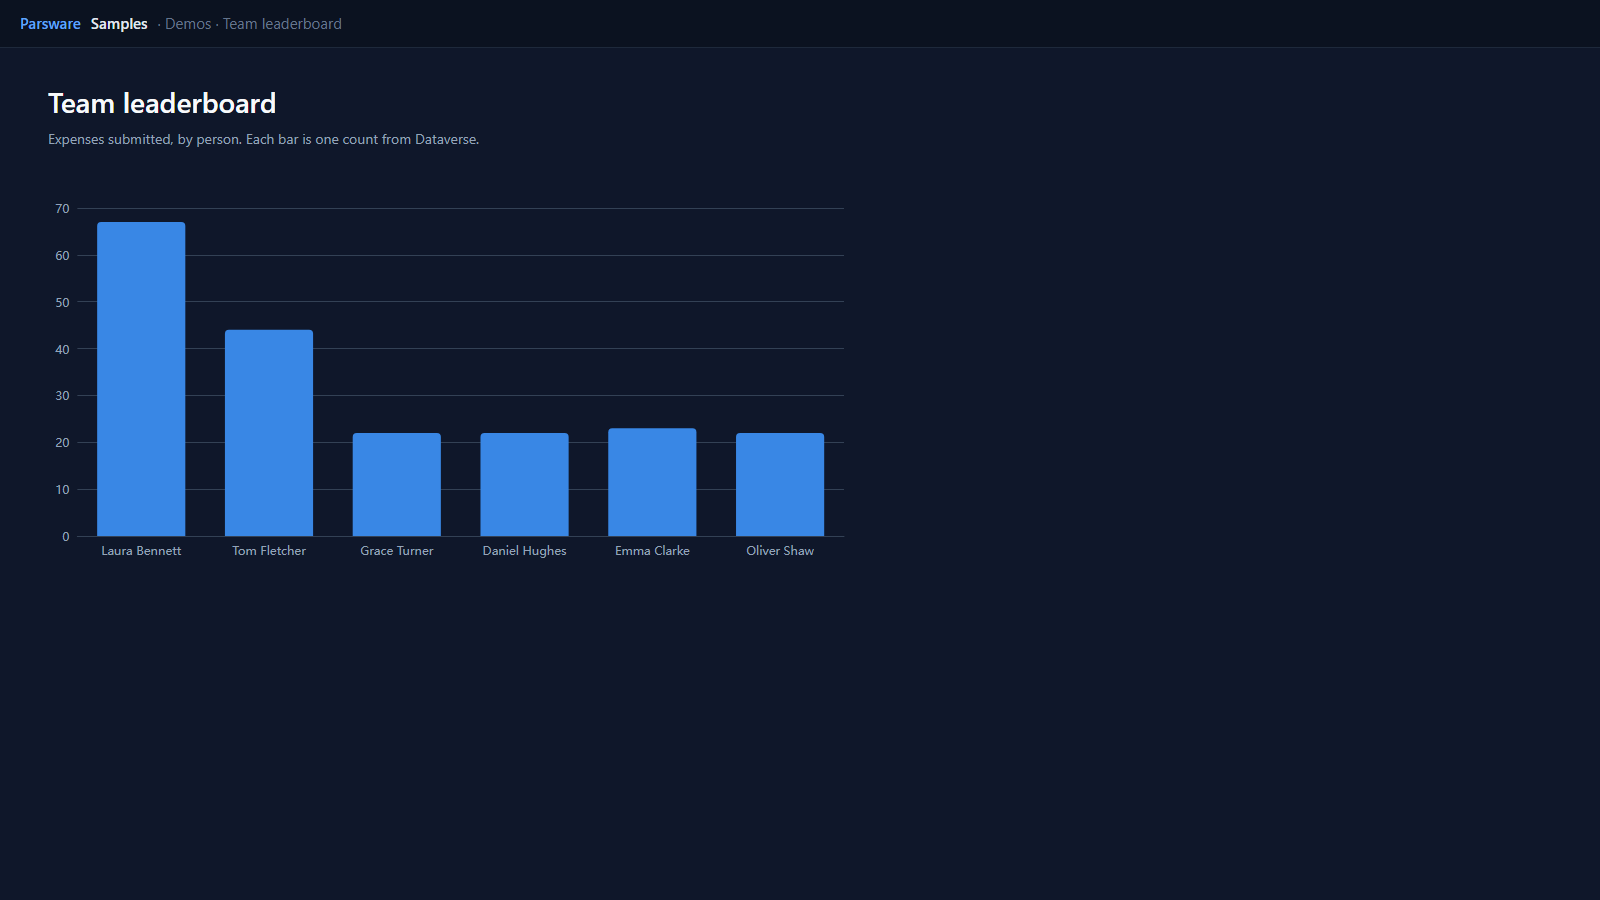
One count per person
Each expense now says who submitted it, in Submitted by. The page asks Dataverse for one count per person when it opens:
loadRecords("par_expense", "sample", { where: { par_submittedby: "Laura Bennett" }, top: 1, countInto: "laura" });
and the chart is bound to a list of label and value pairs made from those counts:
[{ label: "Laura Bennett", value: state.laura }, { label: "Tom Fletcher", value: state.tom }, …]
Counting in Dataverse rather than on the page is the point: countInto asks for the number
and reads one row, so the chart costs the same with a hundred expenses or a hundred thousand.
The board counts every expense ever submitted. To count this month’s, add a date to the
where, or base the chart on a FetchXML aggregate in a report.
Try it
- Install the three Parsware for Power Apps solutions, samples included (Install it).
- Open Sample data and press Replace, so the newest columns are filled (The samples, and sample data).
- Open Demos → Team leaderboard.
The pictures show the shipped design running on demo data in Parsware’s own runtime. In Power Apps it is a page of the model-driven app, with the app’s own dialog and side pane.