For Power Apps
Screens that read Dataverse rows
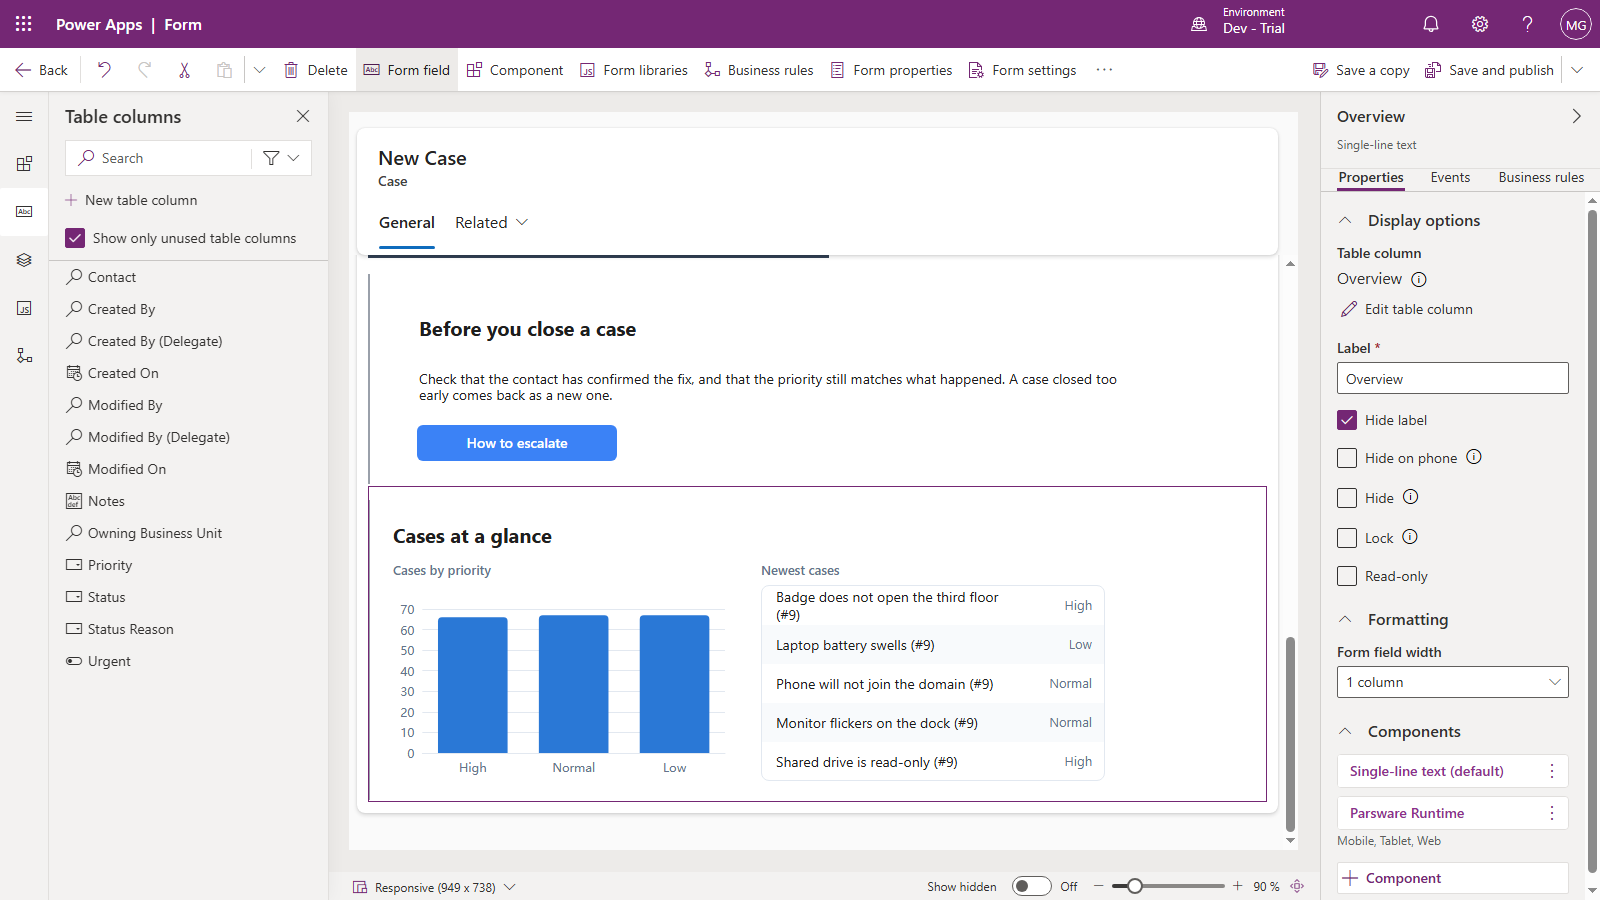
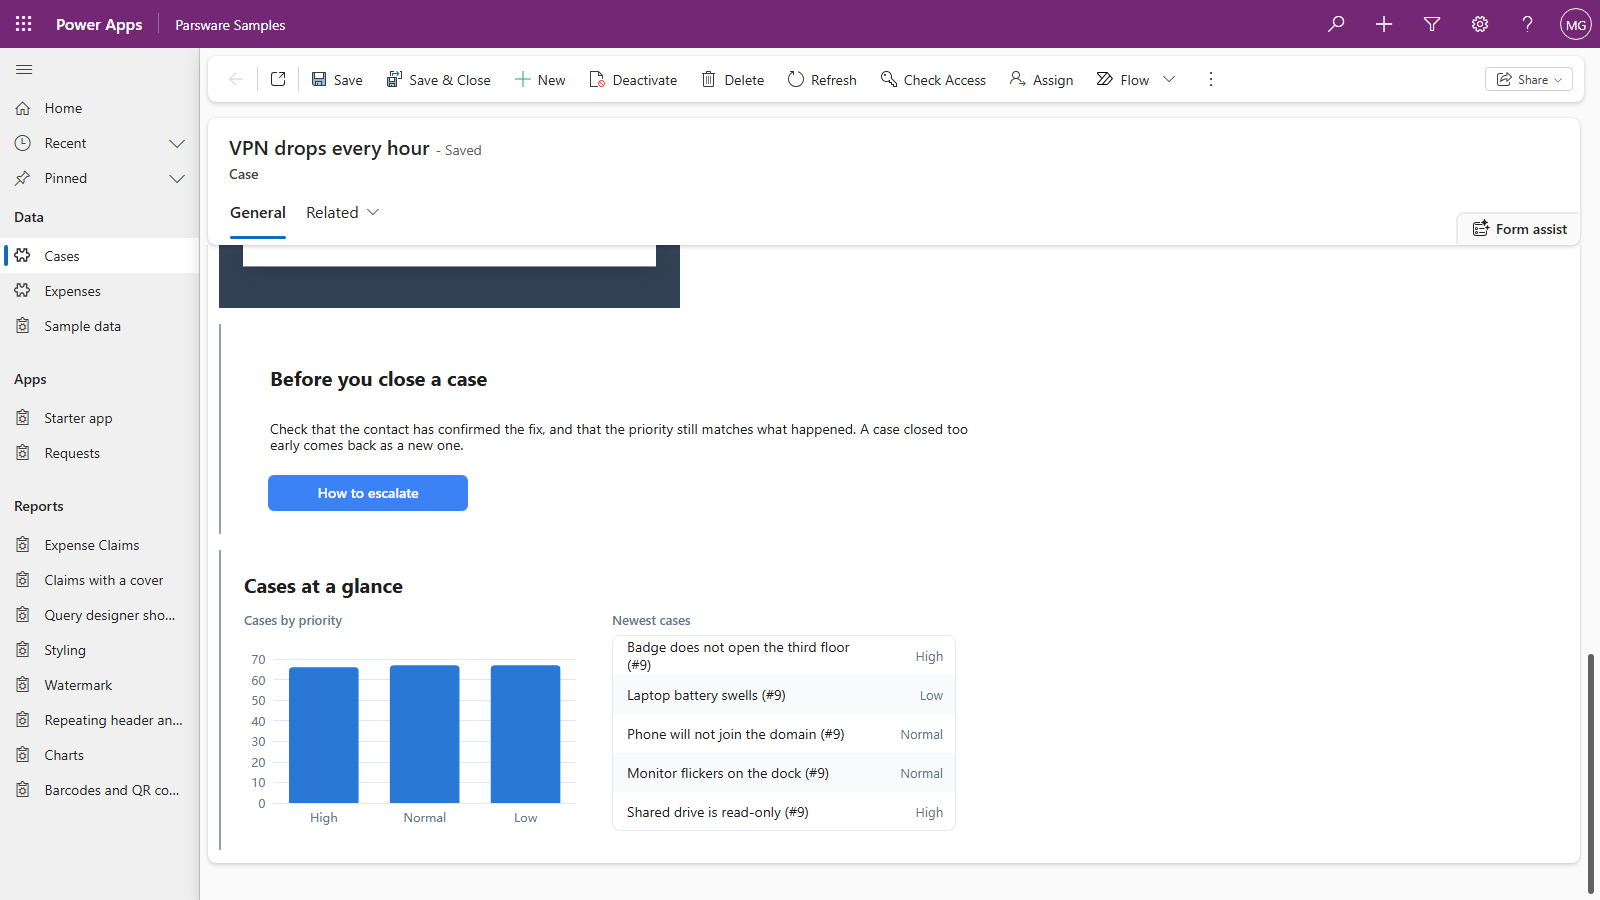
A drawn screen can load real Dataverse rows when it opens, count them, chart them and list them. Here, a panel on the Case form shows how many cases there are at each priority and the five newest ones, read live as the signed-in user.
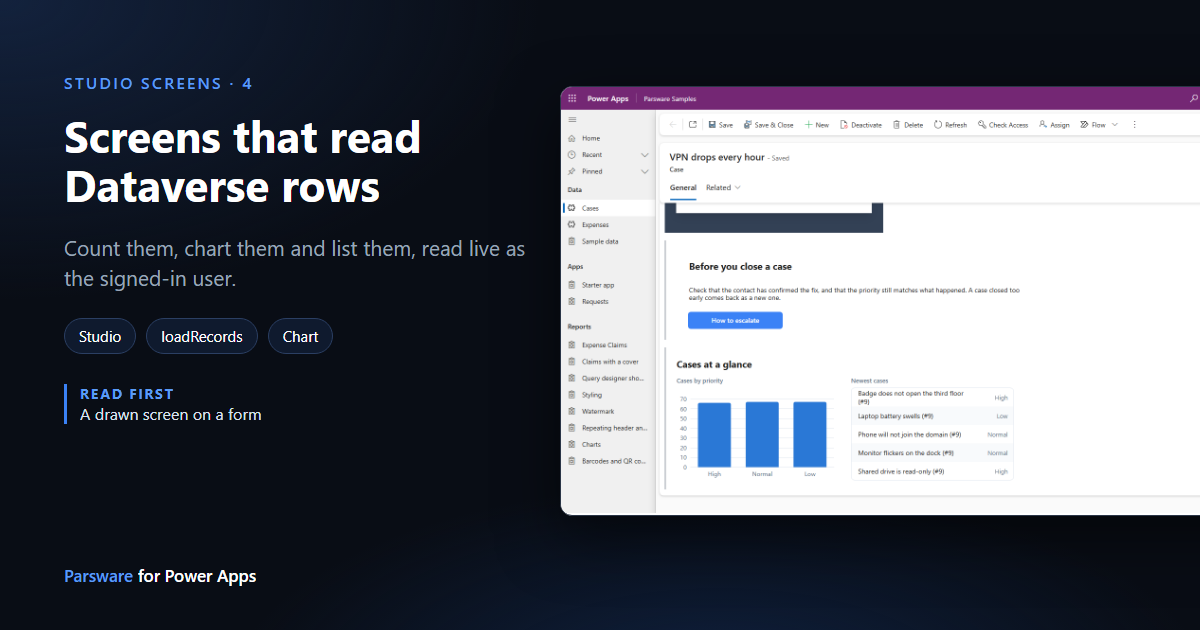
The screens in the last three articles worked with the record they sat on. A screen can also go and read rows of its own: every case at a priority, the newest five, anything you can ask a table for. It reads them when it opens, as the person looking at it, so it only ever sees what Dataverse already lets them see.
We'll add a Cases at a glance panel to the Case form, with a bar chart of how many cases there are at each priority and a list of the five newest cases.
1. Draw the screen
Make a new design as in A drawn screen on a form: Designs › New, name it Case overview, Kind App, then open it in the Designer. Draw a frame 760 × 300, and on its Screen tab set This object is to The screen. Name the frame Overview.
Inside it, draw a heading, two small captions (Cases by priority and Newest cases), and leave room for a chart on the left and a list on the right.
2. Give the screen somewhere to keep the rows
Select the Overview frame. On its Screen tab, under Screen state, press Add a state field for each of these:
| Name | Starting value | Holds |
|---|---|---|
high, normal, low |
0 |
how many cases there are at each priority |
probe |
[] |
a page of rows nobody reads (see below) |
latest |
[] |
the five newest cases |
3. Load them when the screen opens
With the frame still selected, press </> and choose Screen opens. Write four lines:
loadRecords("par_case", "probe", { top: 1, where: { par_priority: 100000003 }, countInto: "high" });
loadRecords("par_case", "probe", { top: 1, where: { par_priority: 100000002 }, countInto: "normal" });
loadRecords("par_case", "probe", { top: 1, where: { par_priority: 100000001 }, countInto: "low" });
loadRecords("par_case", "latest", { top: 5, orderBy: "createdon", descending: true });
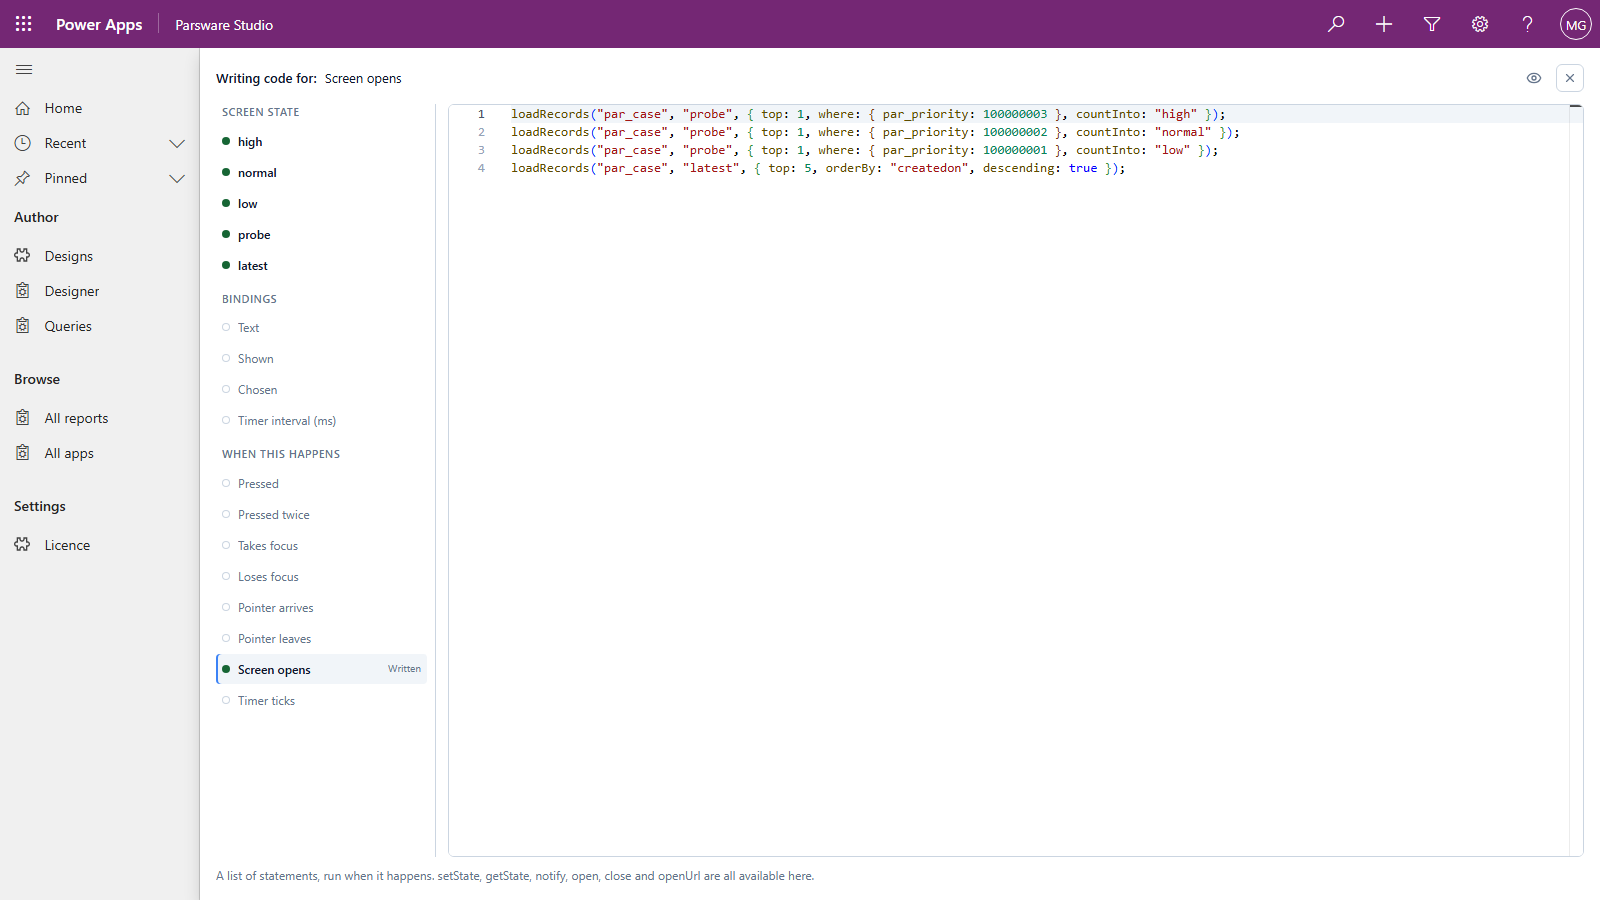
loadRecords takes the table's logical name, the state field to put the rows in, and what to ask
for. As you type the first argument the editor offers the environment's tables by name.
wherekeeps only the rows whose columns match. A choice column is matched by its number; ours are 100000001 (Low), 100000002 (Normal) and 100000003 (High).countIntoputs the number of all matching rows in a state field, not just the ones that came back. That's why the first three ask fortop: 1and drop the row intoprobe: we only want the count, and Dataverse counts as it answers, so it costs nothing extra.orderByanddescendingsort the rows, andtopsays how many to fetch.
4. The chart
Drag Chart from Components onto the left of the screen, 340 × 196. Its Screen tab sets the kind of chart: we left it on Bars.
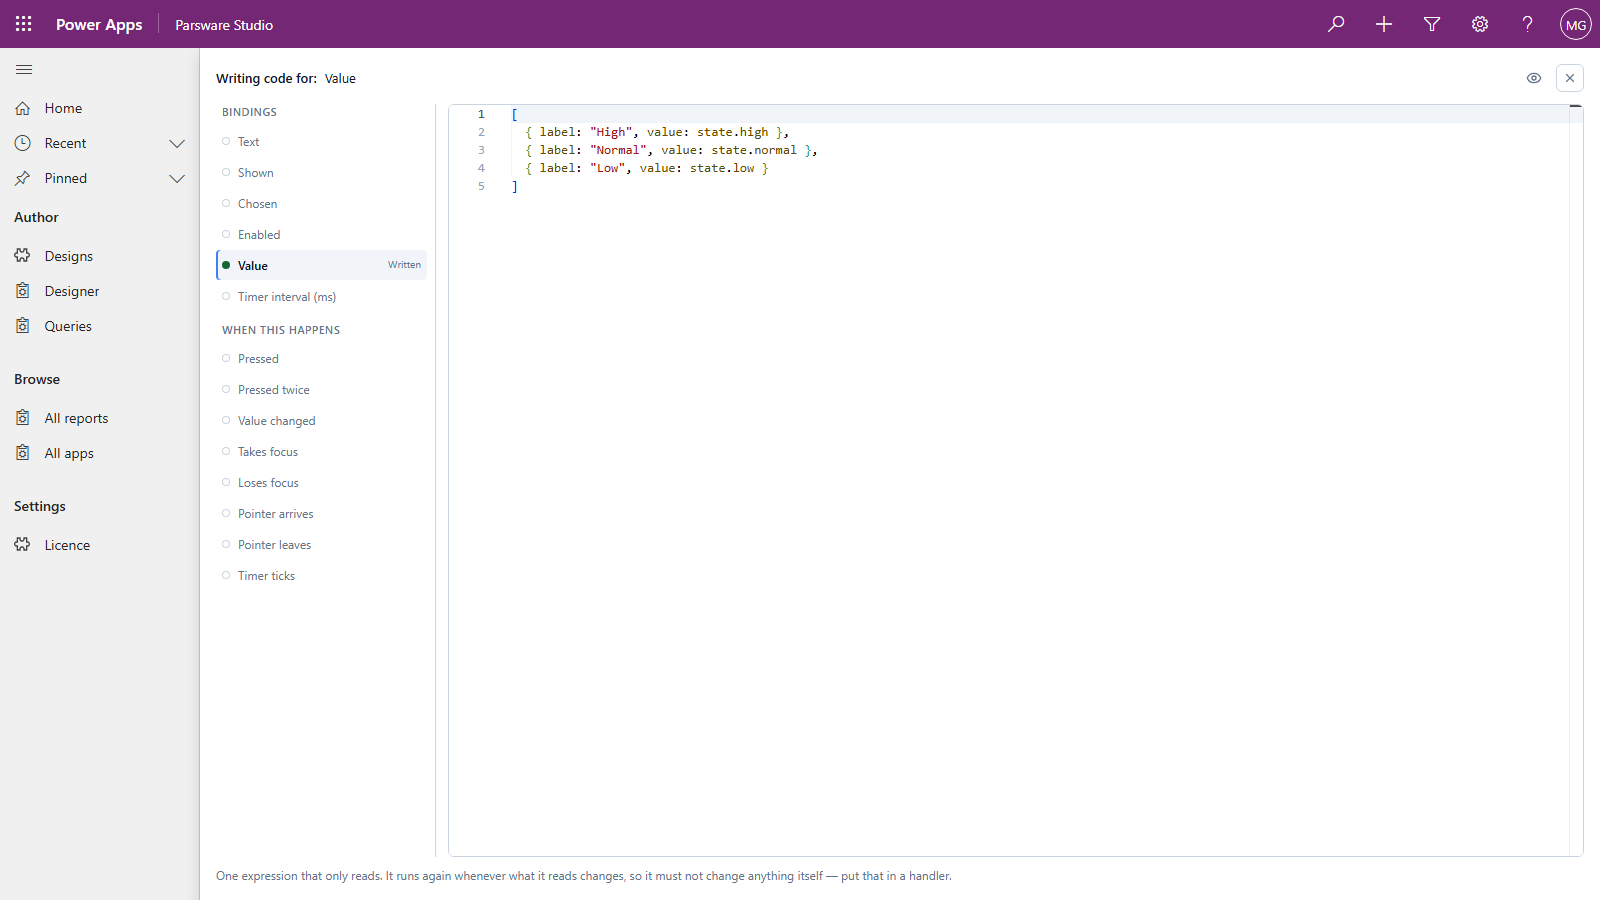
What it draws is its Value: a list of labels and numbers. Press </>, choose Value,
and build it from the three counts:
[
  { label: "High", value: state.high },
  { label: "Normal", value: state.normal },
  { label: "Low", value: state.low }
]
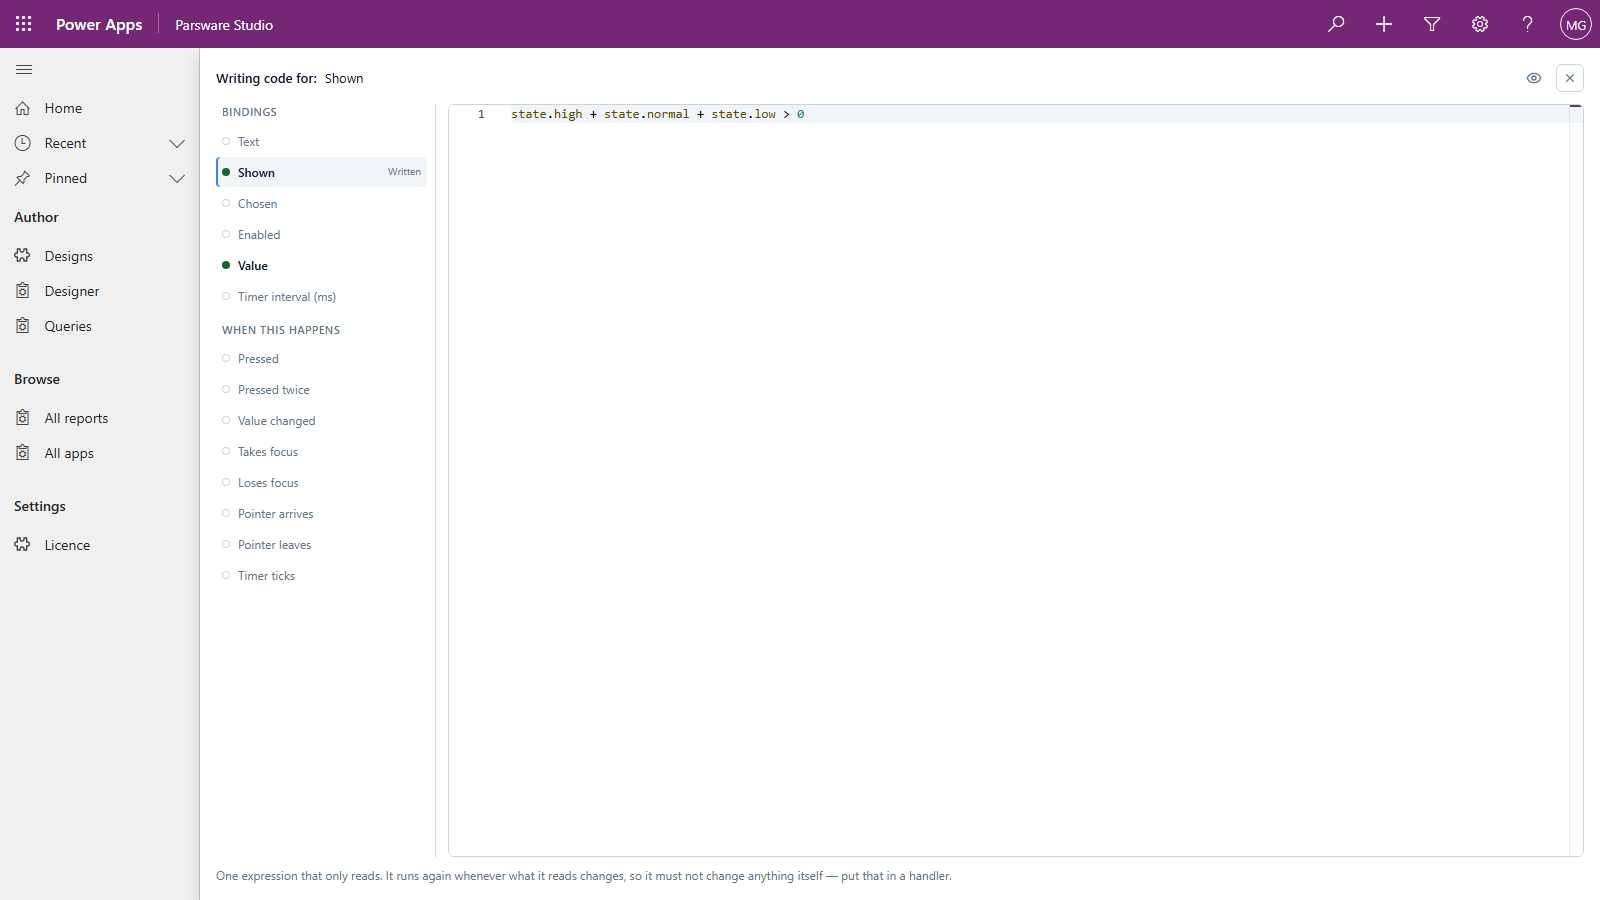
Then choose Shown and write state.high + state.normal + state.low > 0, so the chart appears
once the counts have arrived rather than drawing three empty bars first:
You draw where the chart goes and how big it is. The chart works out its own axis, its ticks and its labels each time it draws, so it copes with numbers you didn't plan for.
5. The list: draw one row, get one per record
On the right, draw a frame for the list, 344 × 196. On its Screen tab, make it A list, and on its Graphic tab turn on Auto layout › Vertical, so the rows stack.
Inside it, draw one row: a frame 344 × 39 with two texts in it. Then:
- Select the row, make it A list item, and set One of these per to
state.latest. That's the whole of the repeat: one row is drawn for every case inlatest. - Bind the first text's Text to
row.par_nameand the second's torow.par_priority.rowis the case that copy of the row is showing.
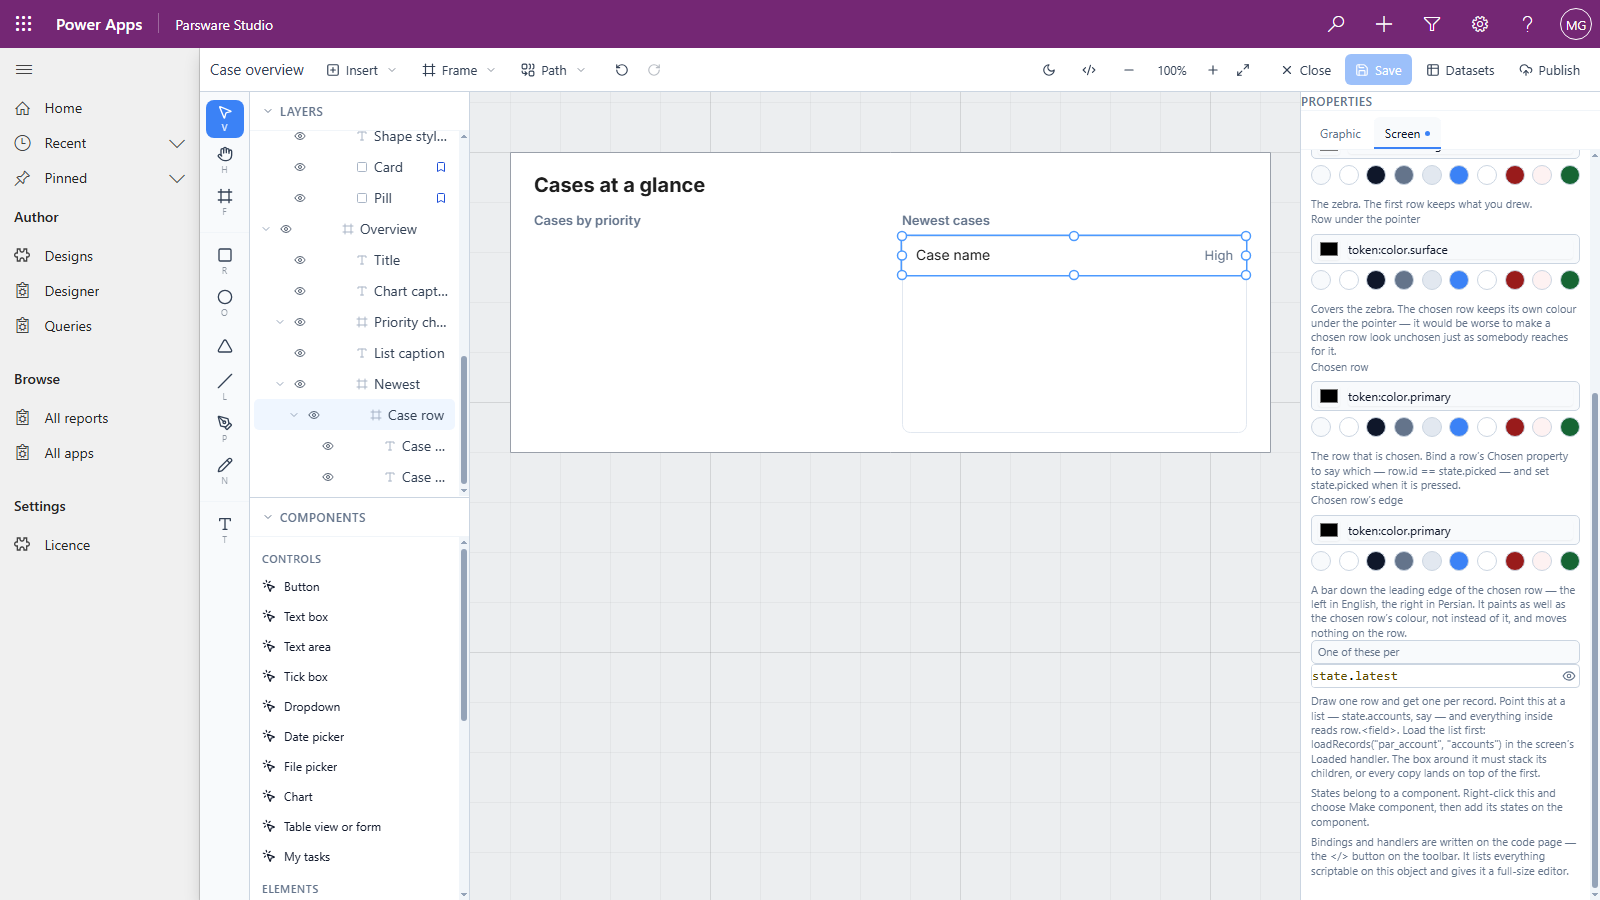
row.par_priority reads High, not 100000003. A choice, a lookup or a status column comes
back with its label, because that's what a screen shows people.
Save, then Publish into your solution.
6. Put it on the form
As before, the component needs a column to sit on: we added a text column Overview to the Case table, in the same solution. In the form designer, add it where the panel should go, tick Hide label, add the Parsware Runtime component and type Case overview as the static Design:
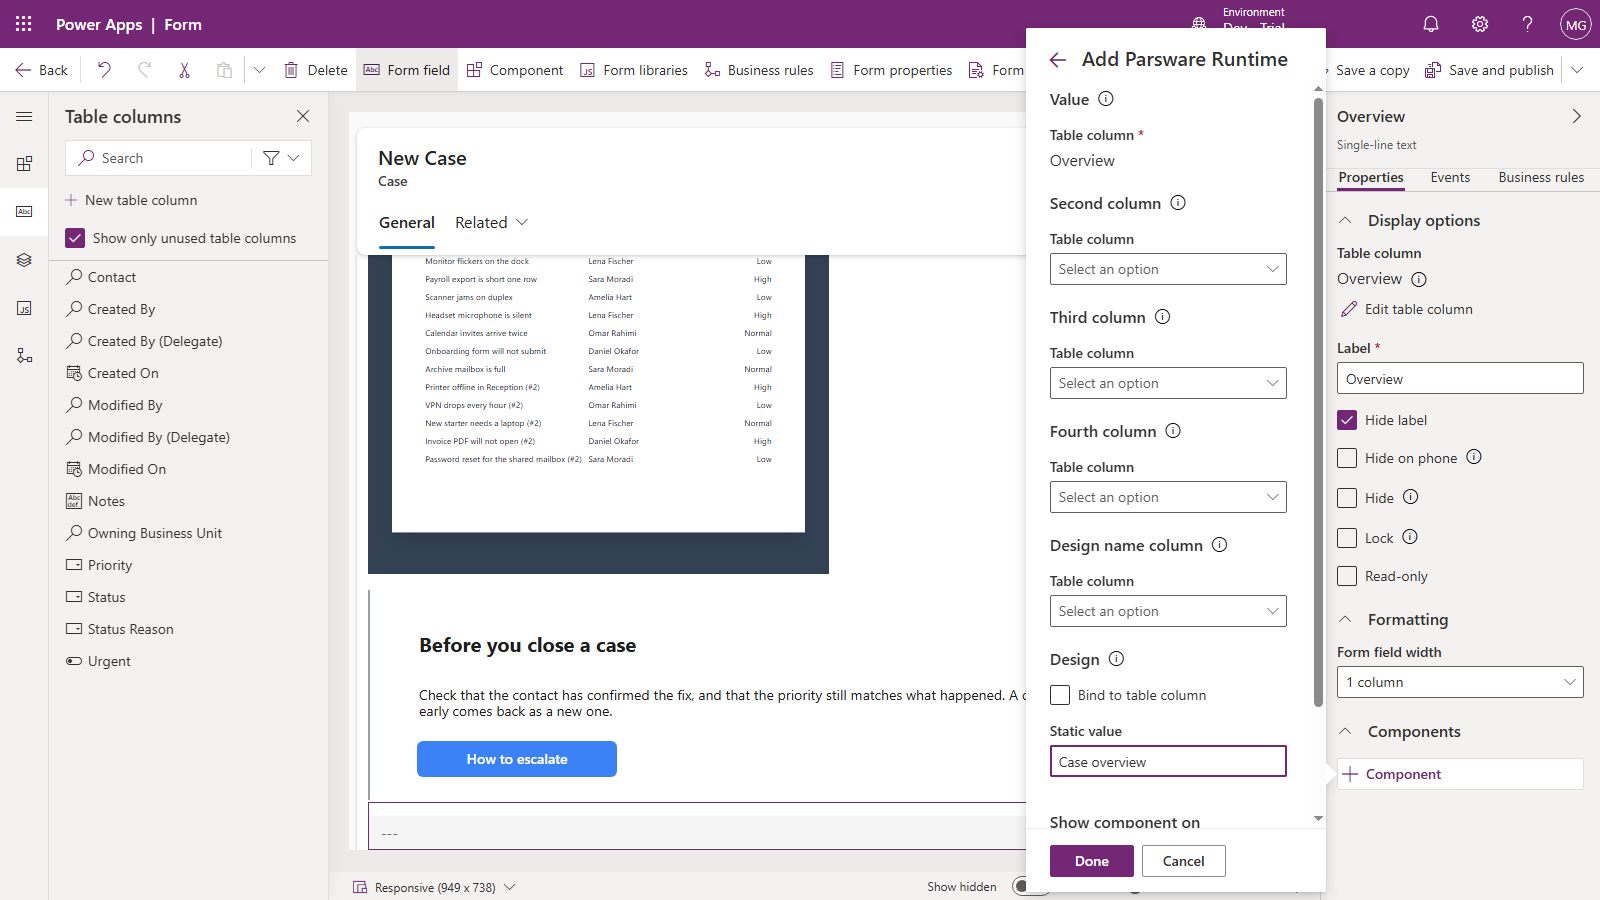
Press Done. The form designer runs the screen for real, so it already shows live counts and the newest cases:
Save and publish, and open a case:
Good to know
- It reads as the person looking at it. The screen asks Dataverse with the signed-in user's own session, so a row their security roles hide is a row the chart doesn't count and the list doesn't show. Parsware adds no permissions of its own.
- It reads when the screen opens. Opening another case runs the queries again. To refresh without leaving, put the same lines in a button's Pressed.
- The panel doesn't know which case it's on. These are queries over the whole table. A screen that works with the record's own values sits on its columns, as in A drawn field.
- Lists can page.
loadRecordsalso takesskip, so a list can show twenty at a time with Previous and Next, andcontainsfilters rows by part of a column for a search box. The Starter app in the samples solution does both.
Next
Modals and drawers from a form: a screen on a form opening a card over the whole page. The whole series is in the reading list.