For Power Apps
The samples, and sample data
The Parsware Samples solution brings two small tables, eight finished reports, two Studio apps and an app that opens them. The tables arrive empty, because a solution carries components and not rows, so one page fills them with 200 rows each. Here is what's in it and how to fill it.
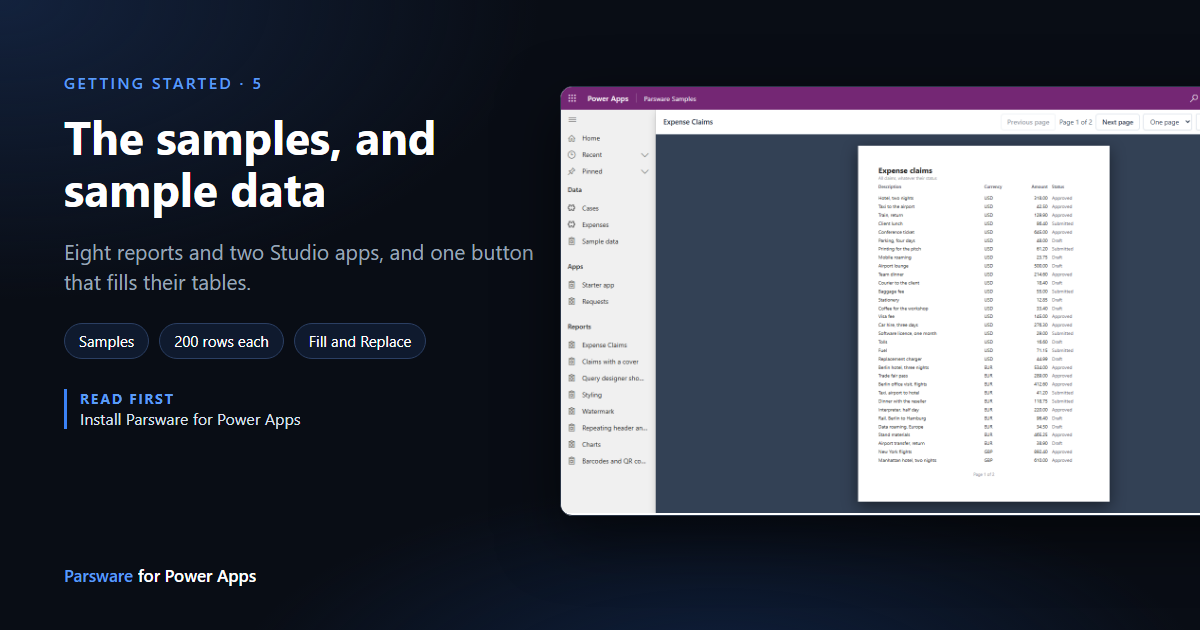
The quickest way to see what Parsware for Power Apps does is to open something finished. That's what the Parsware Samples solution is for: a small, made-up service desk and expenses setup, with reports and Studio apps drawn against it, that you can open, pull apart and copy from.
It's optional, and it's a demonstration. Import it into a development or trial environment, and keep it out of production.
What's in it
samples_managed.zip installs as Parsware Samples. Import it after the runtime, as in the
install article. It brings:
| What | Details |
|---|---|
| Two tables | Case (subject, priority, urgent, notes, a contact) and Expense (claim, amount, currency, status), with their forms and views |
| Eight reports | Expense Claims, Claims with a cover, Query designer showcase, Styling, Watermark, Repeating header and footer, Charts, and Barcodes and QR codes |
| Two Studio apps | Starter app, a support desk over the cases, and Requests |
| An app | Parsware Samples, which opens all of the above |
| A Sample data page | The button that fills the two tables |
Open the Parsware Samples app. Its navigation has three groups: Data (the two tables and Sample data), Apps and Reports, one item for each design.
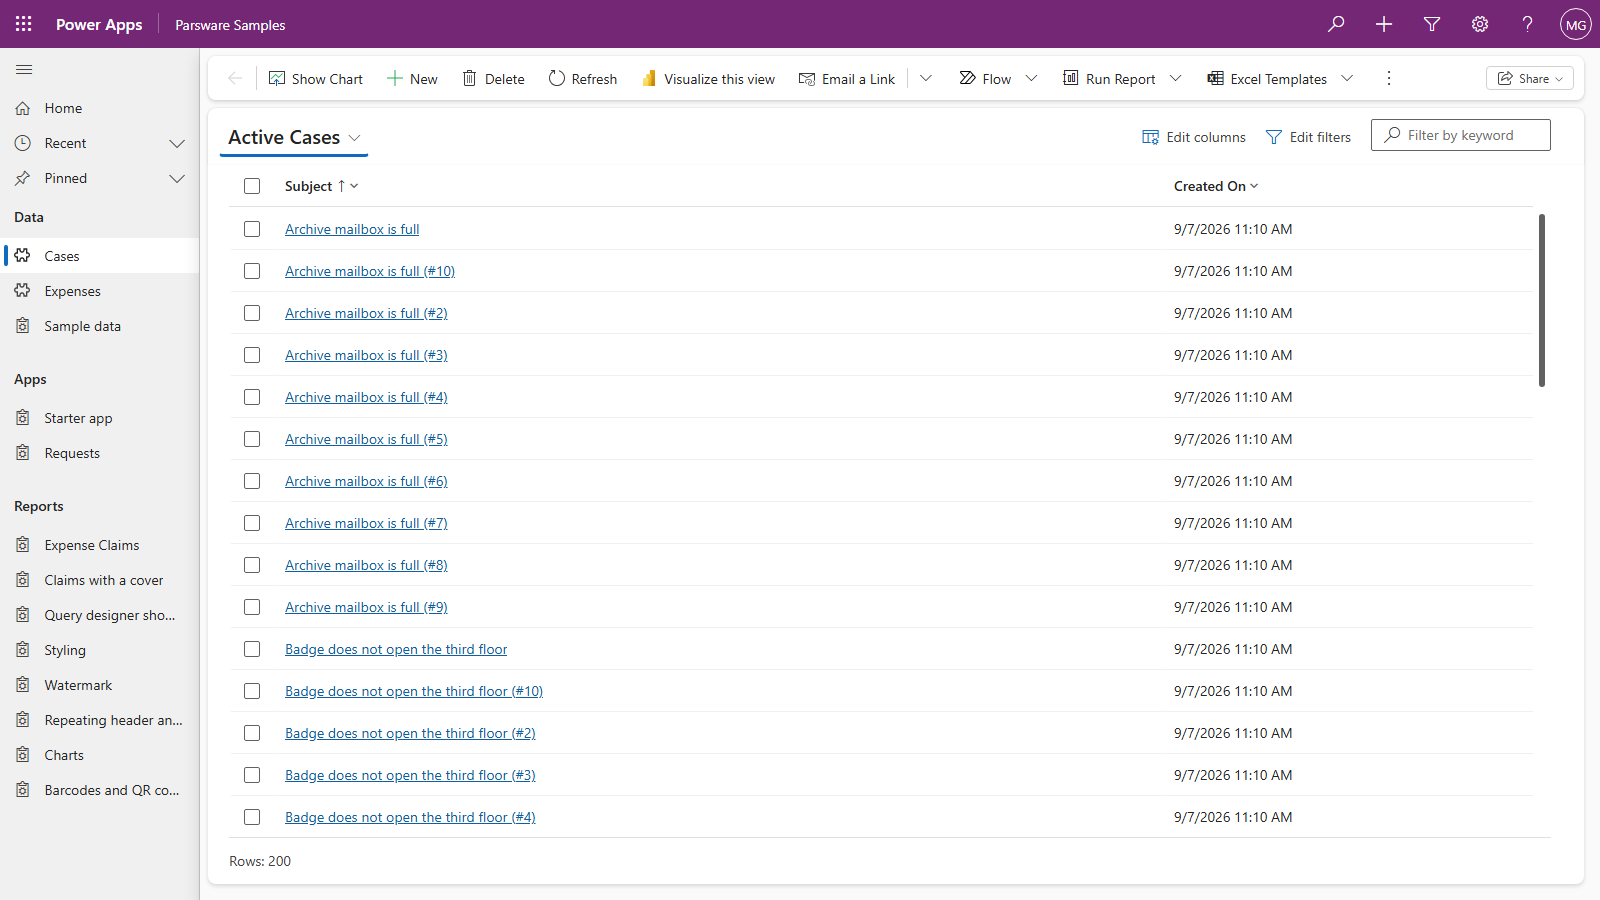
The tables arrive empty
Straight after the import, Cases and Expenses have no rows. A report prints its headings over an empty band, the charts have no bars, and the Starter app's list is blank.
That's not a fault in the import. A Dataverse solution carries components: tables, columns, forms, views, web resources. It doesn't carry the rows inside a table, because rows are data. So the samples solution ships the one thing it can: a page that writes the rows for you.
Fill it
- In Parsware Samples, open Data, then Sample data.
- Press Fill.
It writes 200 cases and 200 expense claims, then lists what it did, table by table.
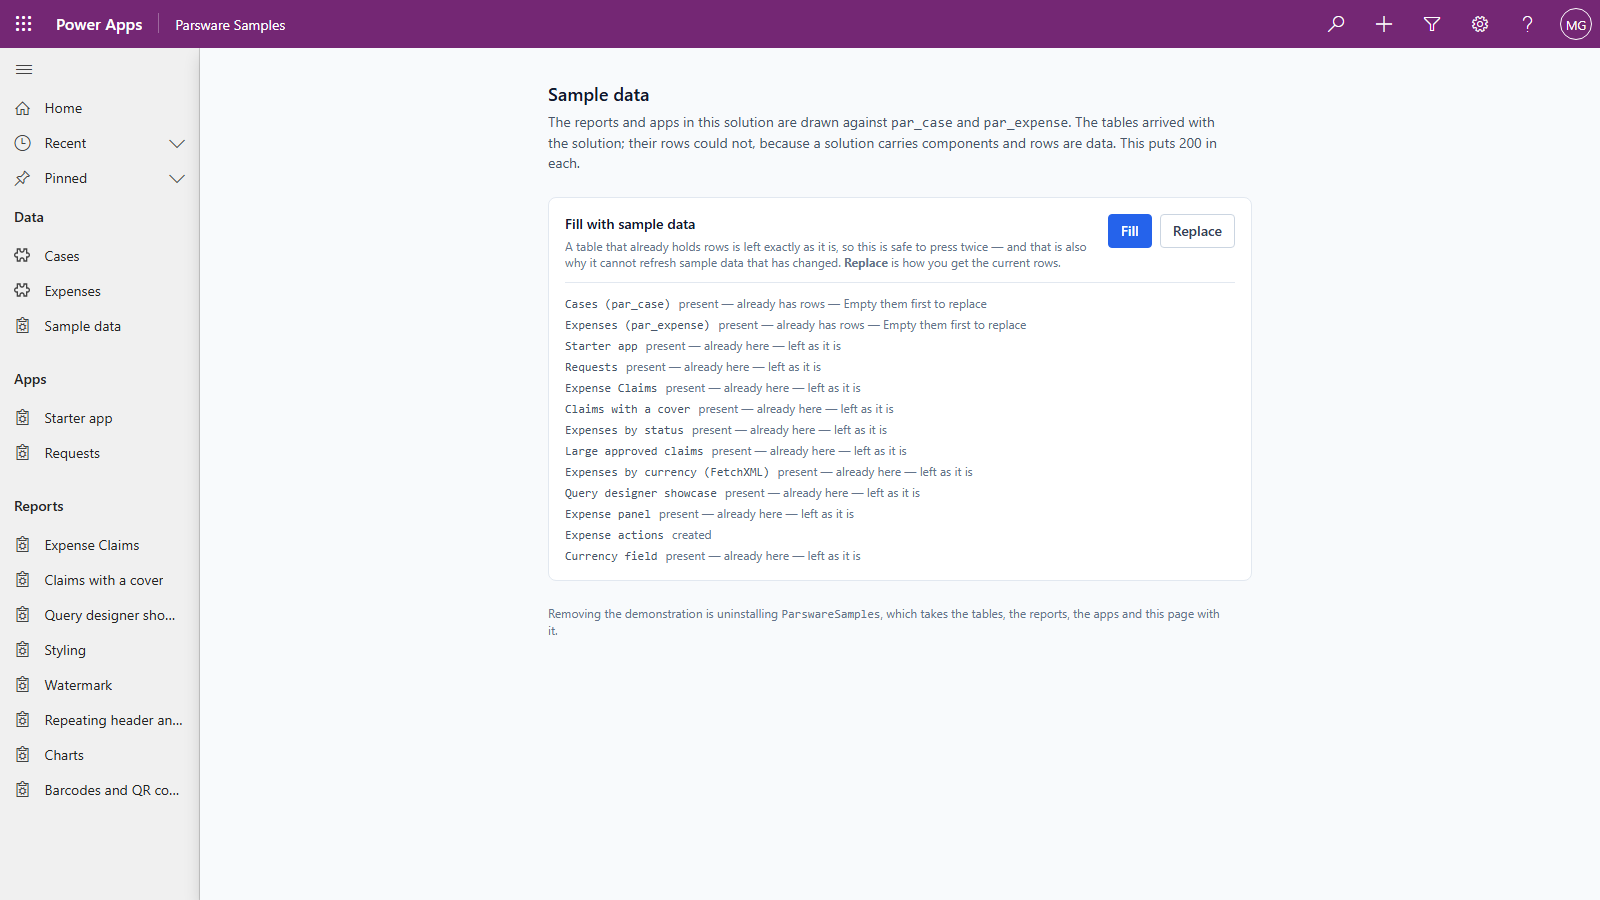
The capture above was taken in an environment that already had sample rows, so it shows the other half of the rule: a table that already holds rows is left exactly as it is. Press Fill twice and nothing is doubled. If you've deleted the samples and put your own rows in those tables, Fill won't grow the samples back over them.
The rows are deliberately uneven, so reports have something to show:
- Three currencies (USD, EUR and GBP), so grouping by currency draws more than one bar.
- Lopsided statuses. Approved claims carry most of the money and Draft claims are the most numerous, so a total, an average and a count tell visibly different stories.
- The same rows every time. Nothing is random, so a printed total can be checked against what you expect.
Each row is its own ordinary Web API create, exactly what a user pressing New sends, so your plug-ins and auditing see them the same way. If the environment has contacts, cases are spread across them.
It also gives you copies you can edit
Fill does one more thing. The eight reports and two apps arrive as published designs, which are finished output: you can open them, but there's nothing in them the designer can edit. So Fill also writes an editable draft of each drawn sample into the Designs list in Parsware Studio, plus the three saved queries the Query designer showcase report reads. That's where you open one, change it and see how it's built.
Replace, when you want fresh rows
Because Fill never touches a table that has rows, it can't refresh them. Replace does: it deletes every row in both tables, then fills them again.
It asks first, and it names both tables, because it really does delete every row, including any you added yourself. The tables, their columns and the designs are left alone.
Look around
With rows in place, everything in the app has something to show. Expenses is an ordinary model-driven view of the 200 claims:
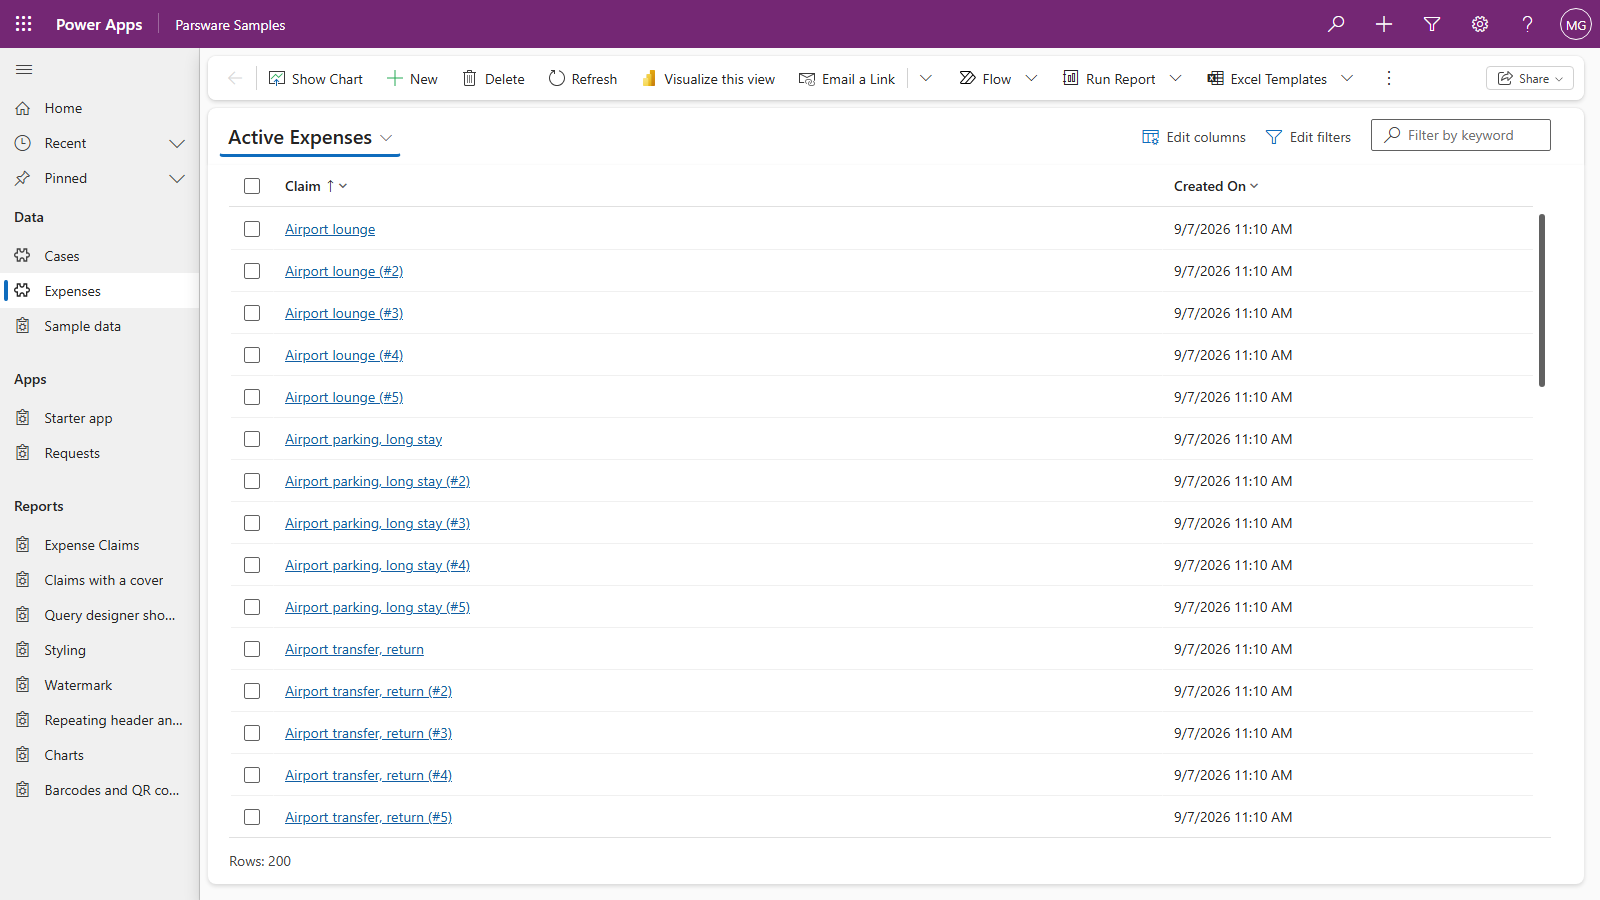
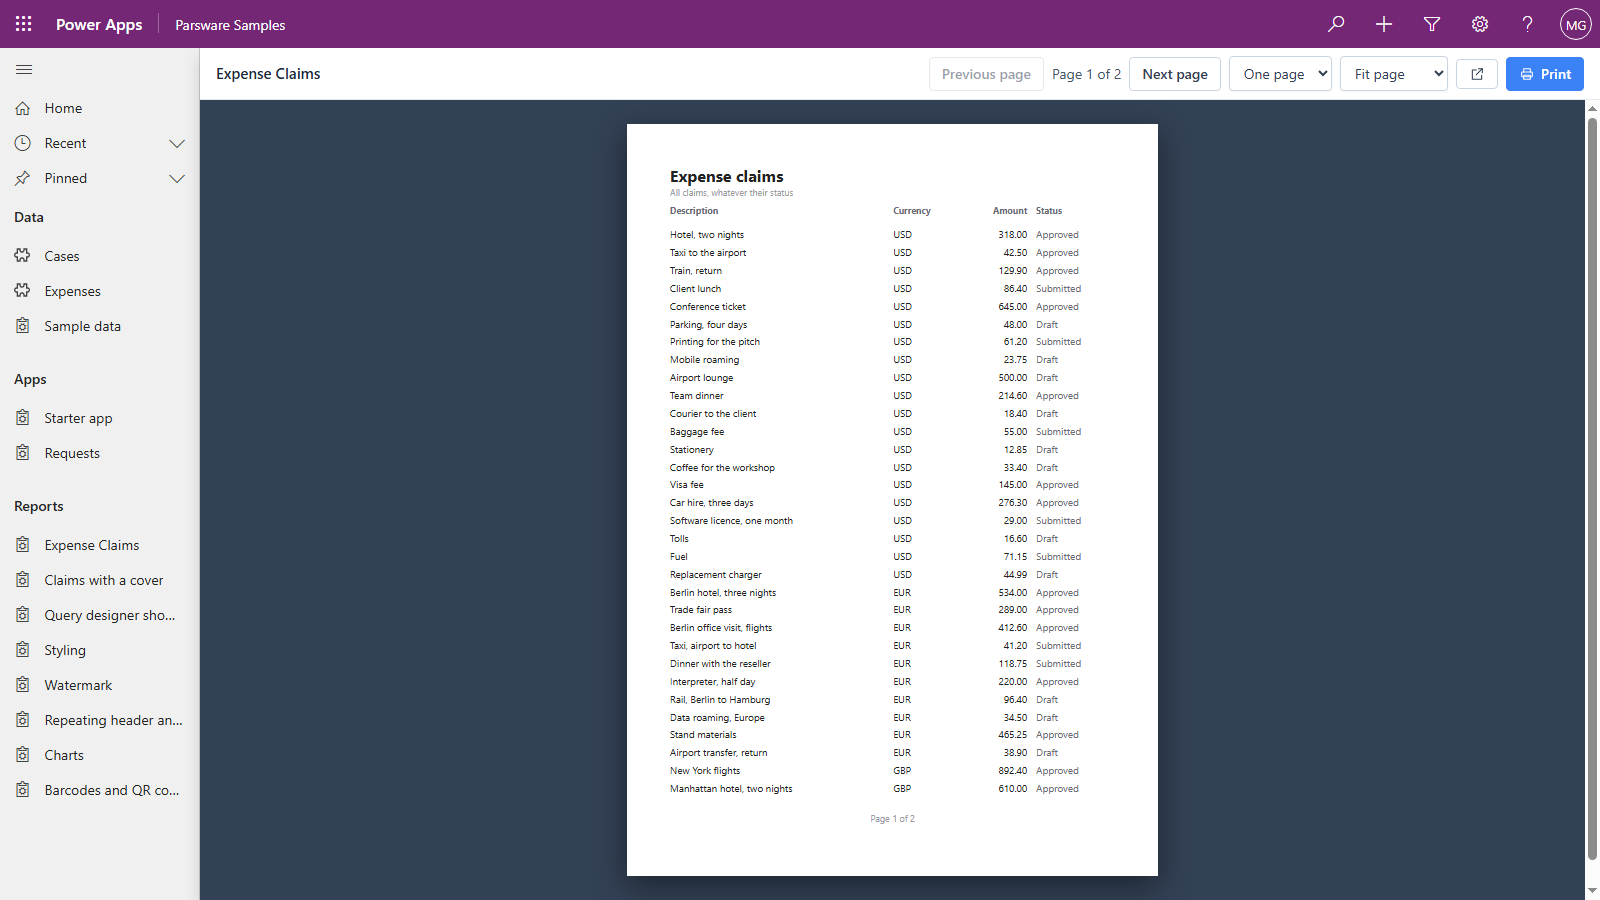
Expense Claims, under Reports, is those same rows as a printed document, with page controls, zoom and Print above it:
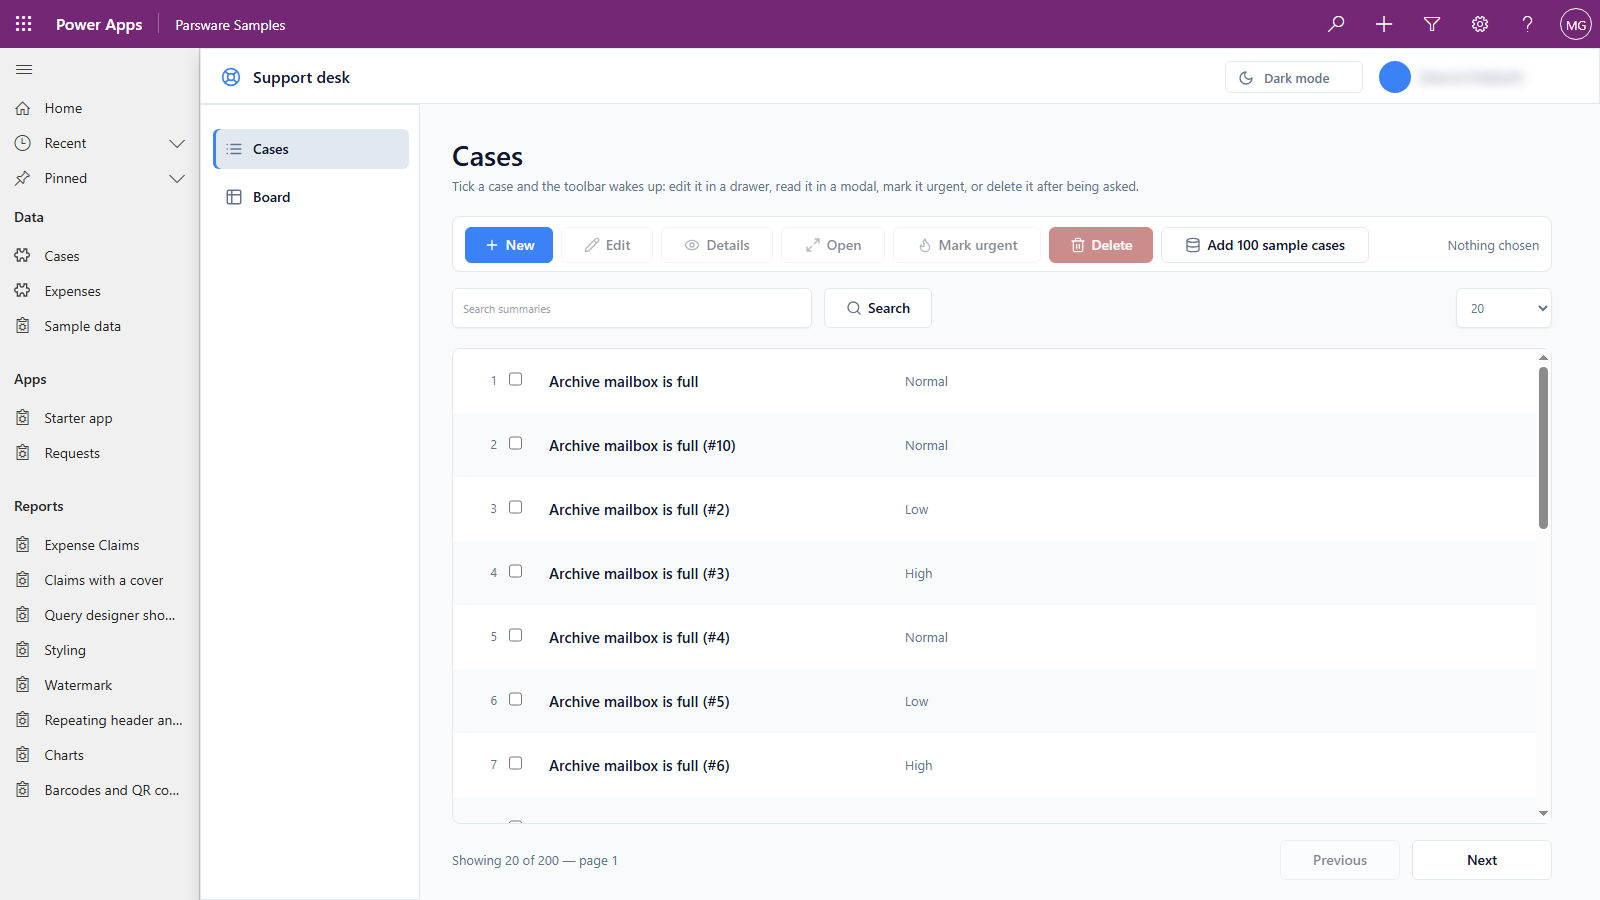
And Starter app, under Apps, is a drawn Studio app working on the cases: a list with search and paging, and a toolbar that adds, edits, marks urgent and deletes.
The rest of this series uses these samples, so it's worth filling them now.
Removing the samples
Uninstall Parsware Samples from Solutions. That removes the two tables and their rows, the designs, the app and the Sample data page in one go. The runtime and anything of yours are untouched. The editable drafts Fill wrote are rows in the Designs list, so delete those in Parsware Studio if you don't want them.
Next
The next series is reports. It starts with your first report on Dataverse: a report bound to a table, drawn and previewed. The whole series is in the reading list.