Parsware Platform
Groups and totals
Three totals on one report and a table of groups: a total row under the claims, a per-page total in the footer, and the claims by status from a saved query that groups, with a total of its own. Where each total looks, and why grouping belongs to the dataset.
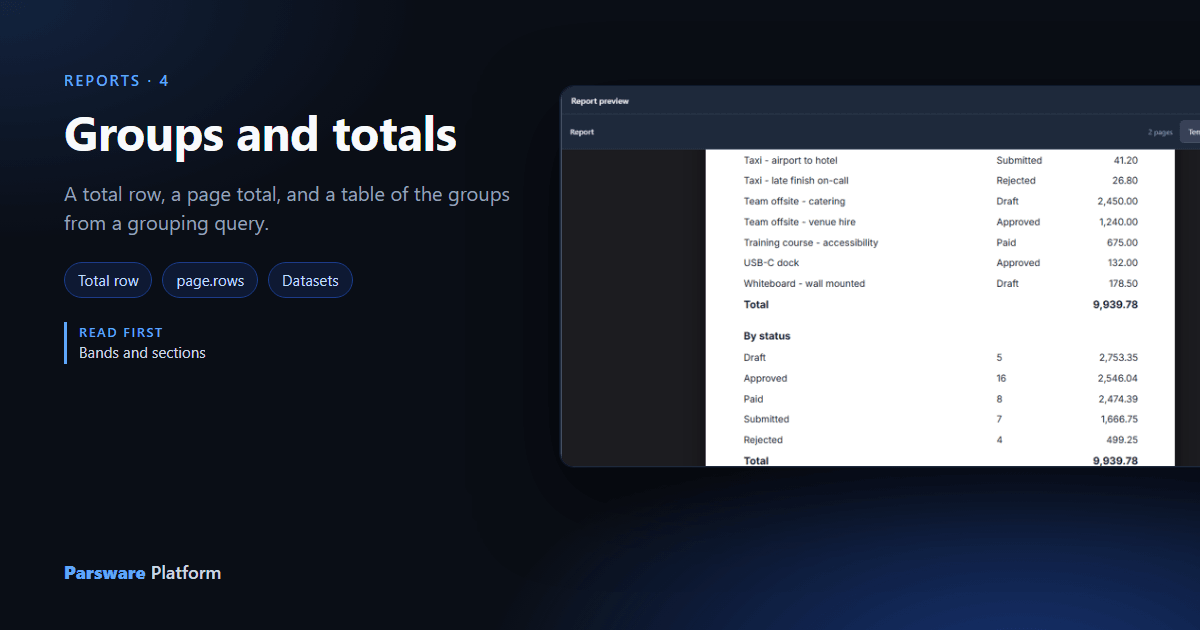
Claims by status, the report made in article 137, lists every claim with its status and amount. It doesn't add anything up yet. This article gives it three totals and a table of the claims grouped by status.
1. A table total
A total that comes once, after the last row, goes in a total row: a band directly under the repeater, tagged on the Report tab.
We duplicated the Body title band (Ctrl+D), moved it under the row, renamed it Total row, and ticked Total row for the repeater above:
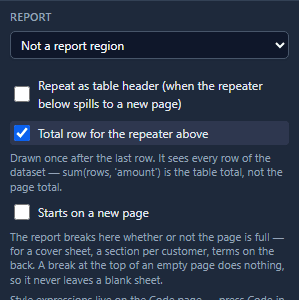
Its first text says Total. Its second, under the amounts, needs an expression rather than a field, so it is written on the Code page: select the text and press Write code in the toolbar. What it shows is the binding:
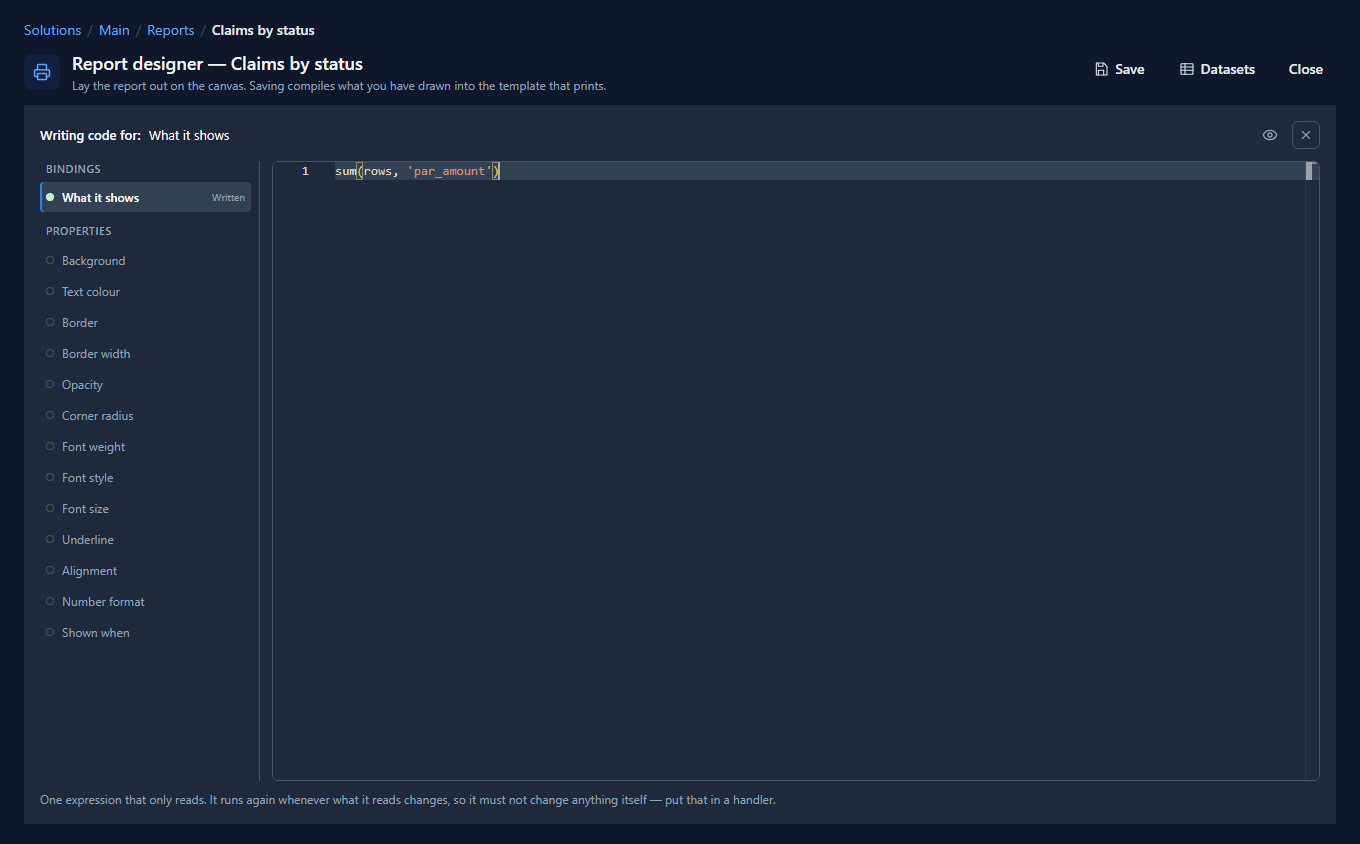
In a total row, rows is every row of the dataset, so sum(rows, 'par_amount') is the whole
table's total however many sheets the table takes. Format number on the Report tab prints it
with two decimals.
2. A page total
A different question is what the claims on this sheet add up to. That goes in the page footer,
where page.rows is the rows that landed on the sheet being drawn:
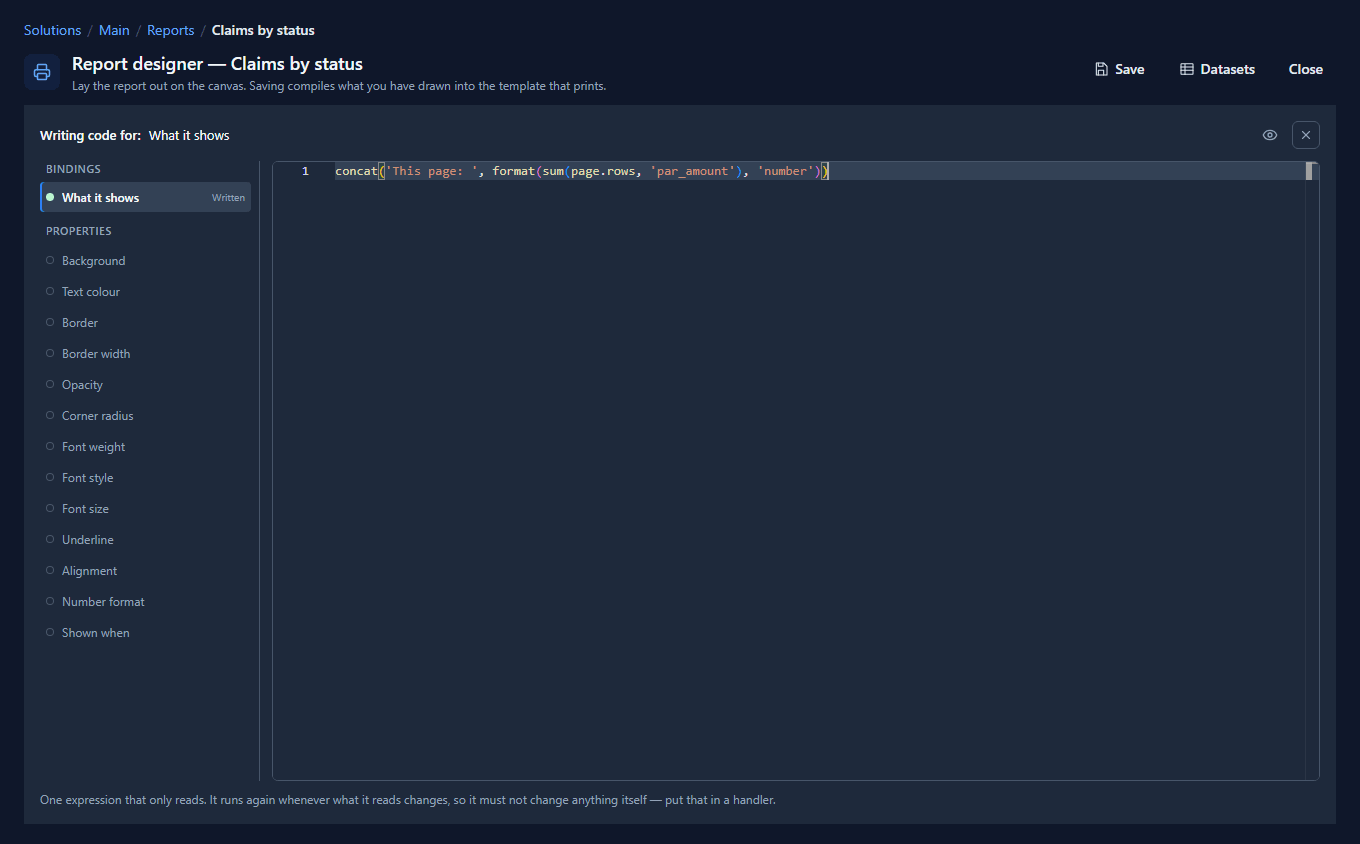
format(..., 'number') writes the sum the way the Format picker would, inside a sentence. The
starter page's footer had been reading a report dataset this report doesn't have; this replaces
it.
Both totals are useful, and they are different numbers. Pick the one the reader needs.
3. Groups come from the dataset
The claims grouped by status (each status, how many claims and their total) is a question for the
query rather than for the drawing. A saved query can group and count, as
article 049 showed, and the Expense Overview sample
(mda-expense-overview-dashboard) already has one: Expense total by status, one row per status
with claims and total.
Press Datasets in the designer's title bar, Add a second dataset named bystatus, and
choose that query:
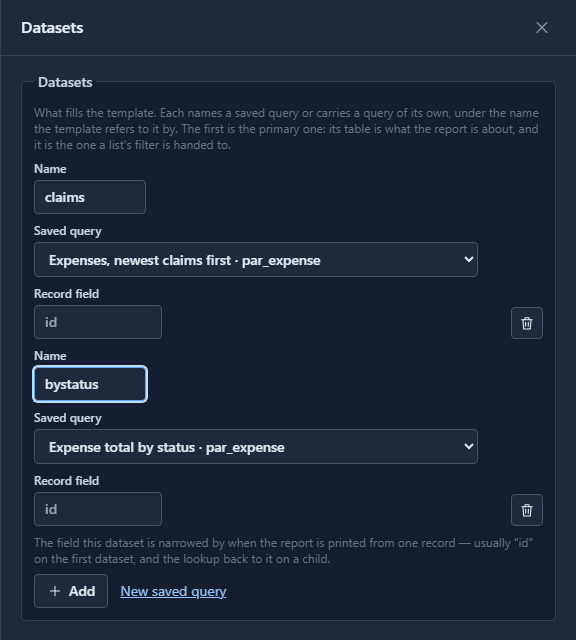
Leave Record field empty for it. A group has no id, so there is nothing to narrow it by when the report is printed from one claim.
4. A table of the groups
Under the total we added a heading band, By status, and a copy of the claims row. On the copy's
Report tab, Repeat over now offers both datasets. Choosing bystatus asks first, because the
row's three texts were bound to the claims:
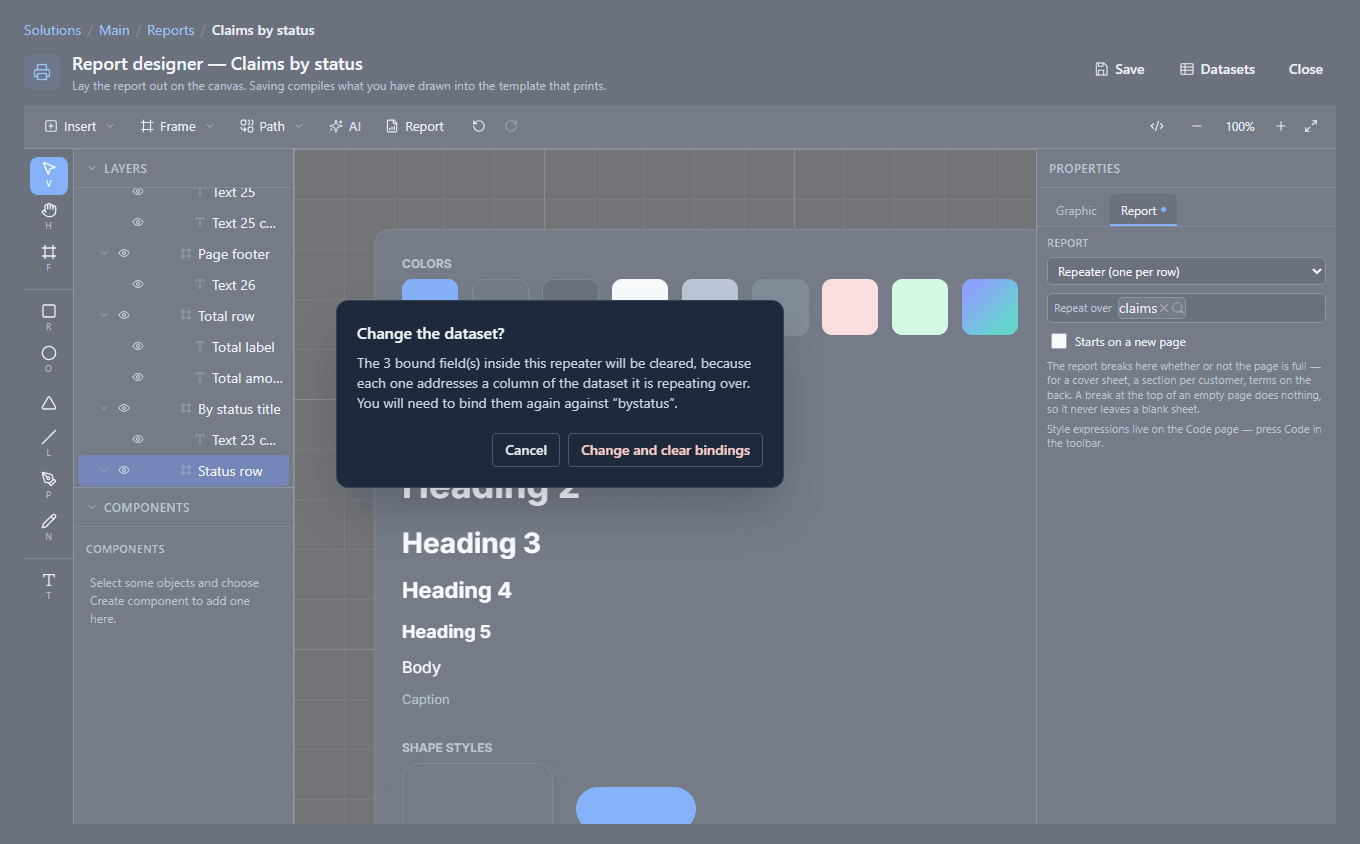
After Change and clear bindings, the Binding picker lists the grouped query's columns:
Status, claims and total. We bound the three texts to them, and copied the total row under
it, with sum(rows, 'total'): here rows is the groups, so the total adds the groups up.
5. The result
Press Report. The claims end with their total, the groups follow with theirs, and the footer gives the sheet's own sum:
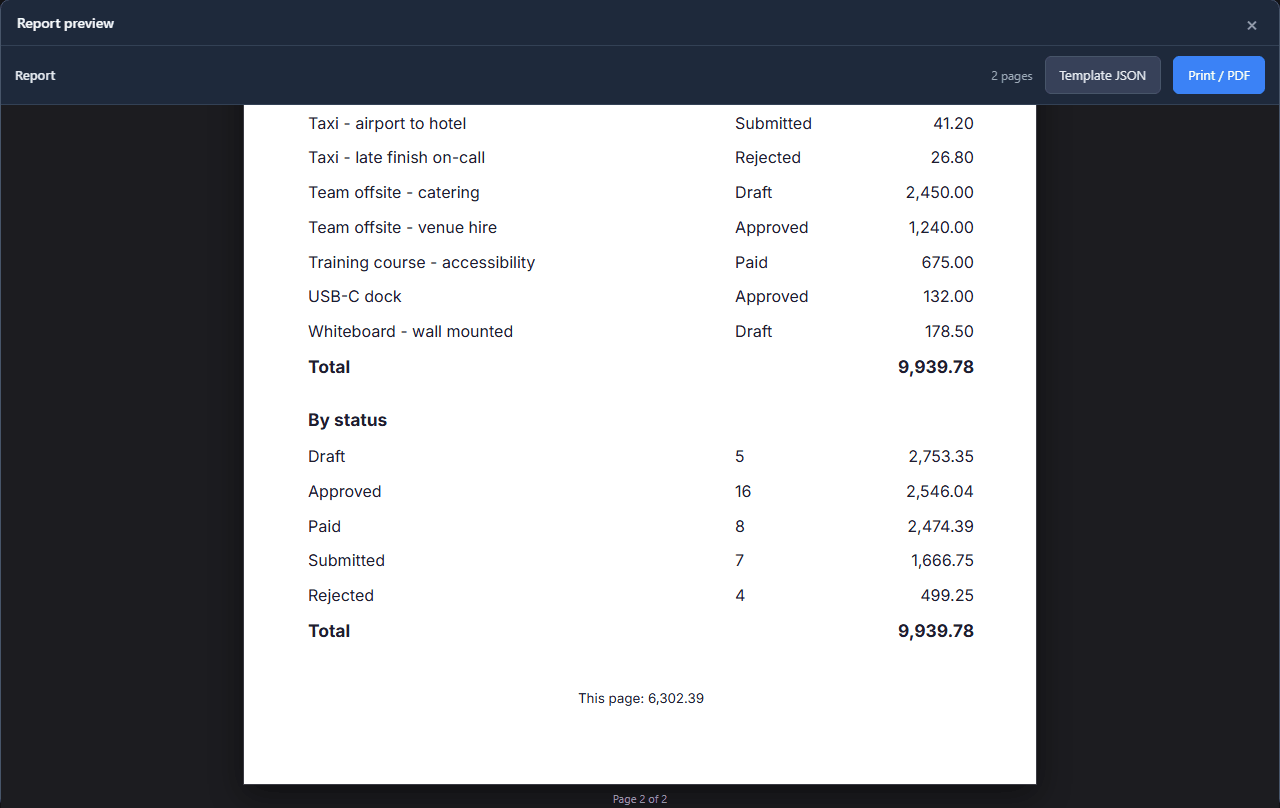
The two totals agree, which is a check worth having on a report: the groups came from a second query, and they add up to the same 9,939.78 as the rows.
Why not group in the drawing
A repeater walks a dataset, and its row is one band. A second repeater drawn inside that row does not repeat, so a report can't print each status as a heading with its own claims listed under it. What it can print is what this one does: the rows, then the groups, each from its own query. The help page used to describe the nested version as if it worked, and the AI was being told to build it. Both now describe what prints.
Two other totals need no query of their own:
- A running total is
sum(take(rows, rowIndex + 1), 'par_amount')in the row itself. - A count is
count(claims), as the cover in article 138 does.
What we fixed
Building this turned up problems, now fixed:
- The Code page underlined working expressions.
sum(page.rows, 'par_amount'), the per-page total the help page and the eye panel both offer, was marked Has an error ("Class definition for identifier not found") while it printed correctly. So was any binding that read a dataset by name, such asclaims[0].par_name, which the Binding picker itself writes outside a repeater. The editor now knows every name the report engine puts in scope. - The help page and the AI described grouping that never printed (above).
Try it
Import Expense Reporting (reporting-expense-claims) for the claims and Expense Overview
(mda-expense-overview-dashboard) for the grouping query, then give a report of your
own a total row, a page total and a table of the groups.
Next: expressions and formats.