Parsware Platform
Create a report and bind it to a table
A new report over the expense table: a dataset that names a saved query, a starter page from the Insert menu, a repeater over the claims, three columns bound to fields from a picker, and a preview with the real rows, two pages of them.
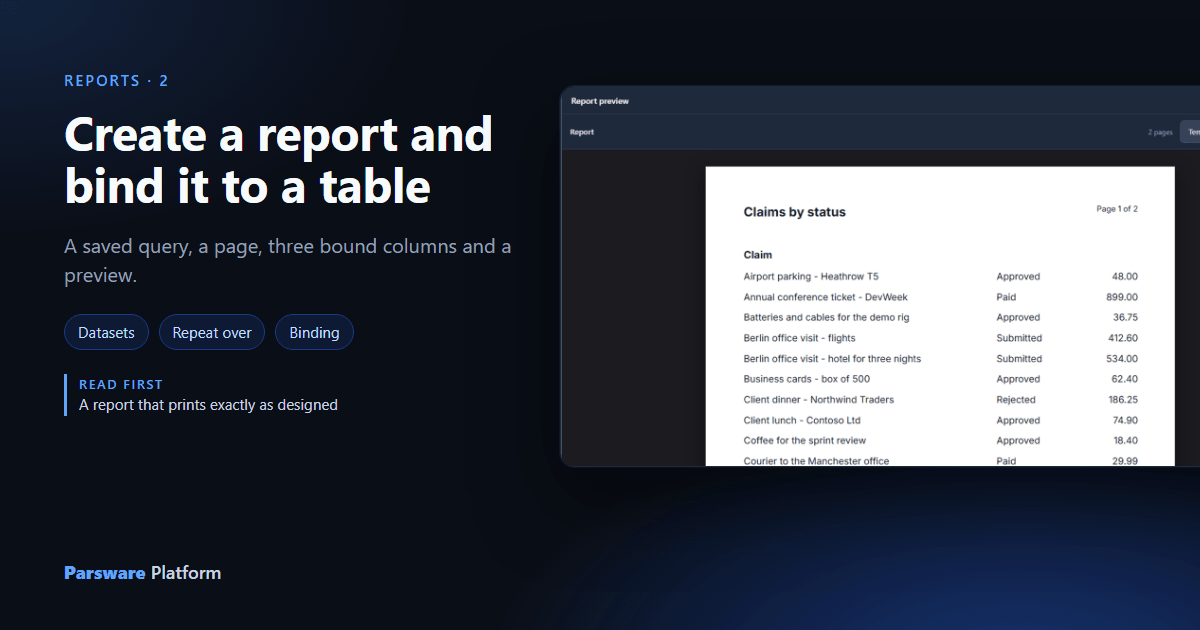
The last article looked at a finished report. This one makes one from nothing: Claims by status, a line per expense claim with its status and amount, over the same expense table.
1. A report and its dataset
A report is two halves that meet at a name: the datasets, which are the rows, and the drawing, which is the page. The datasets come first.
In your solution, open Reports and press New. We filled in:
- Display name Claims by status. The logical name follows it:
new_claimsbystatus. - A description.
- Under Datasets, one row: Name
claims, and Saved query Expenses, newest claims first.
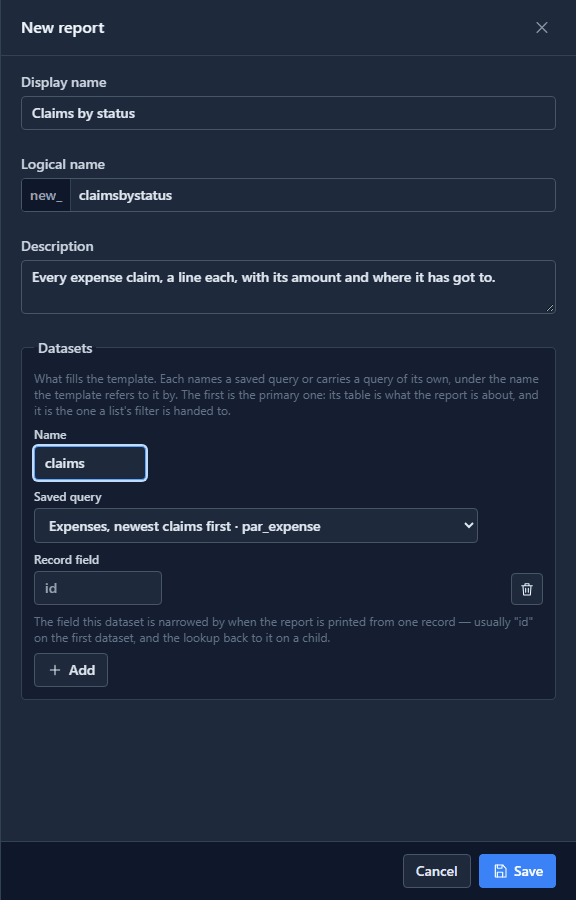
The saved query is chosen, not typed, and each option says which table it reads. That's how a
report is bound to a table: through a query that reads it. The first dataset is the primary one,
so its table, par_expense, is what the report is about. (Saving a query is
article 048.)
Record field is id. That's what narrows the report to one claim when it's printed from an
open record; printed from the navigation, it covers every claim. Press Save. The platform checks that
the query would really run in this environment, so a misspelt field is refused now rather than by
whoever presses Print.
2. A page to draw on
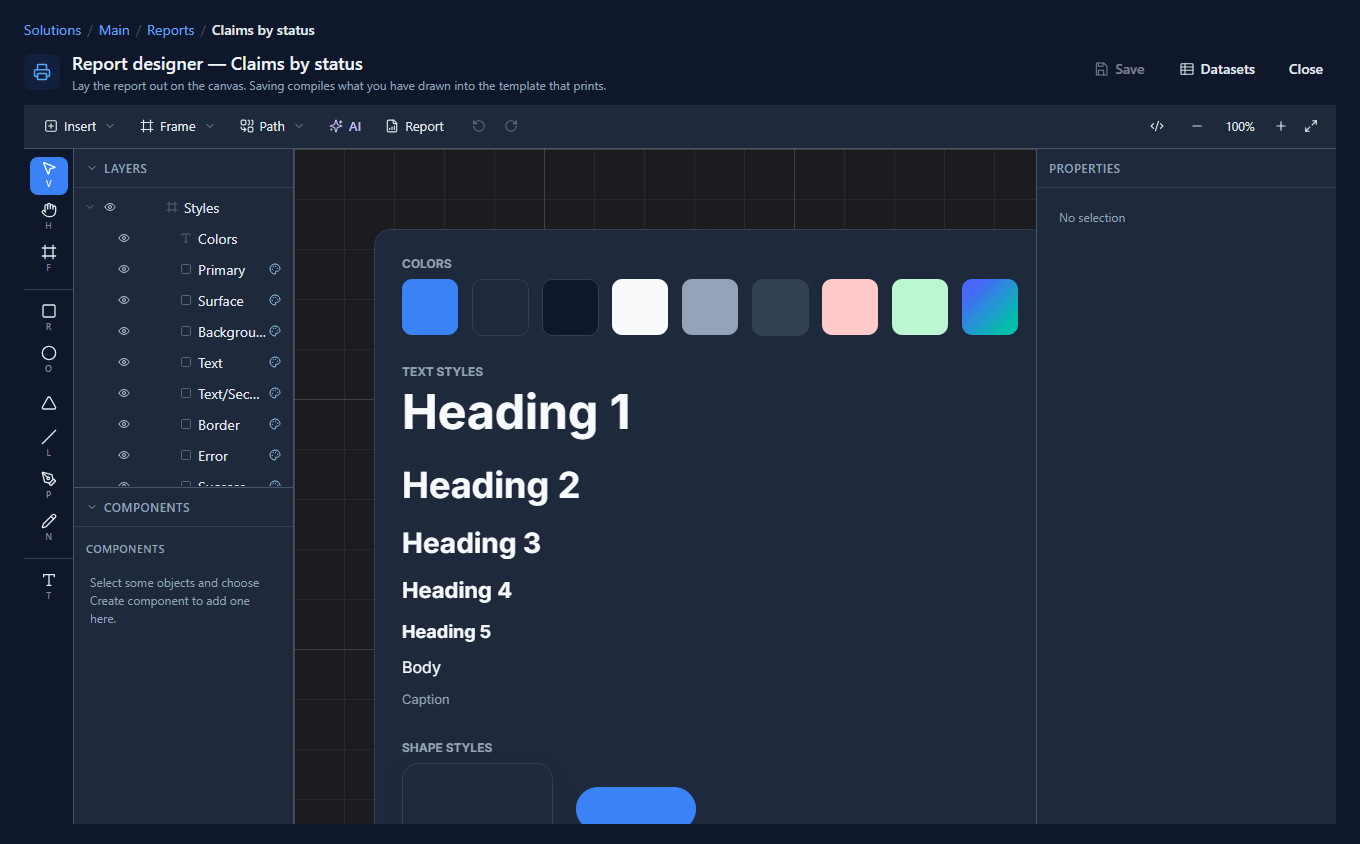
Select the report and press Design. A new report's canvas has only the Styles board on it, the colours and text styles a design starts from, which never prints:
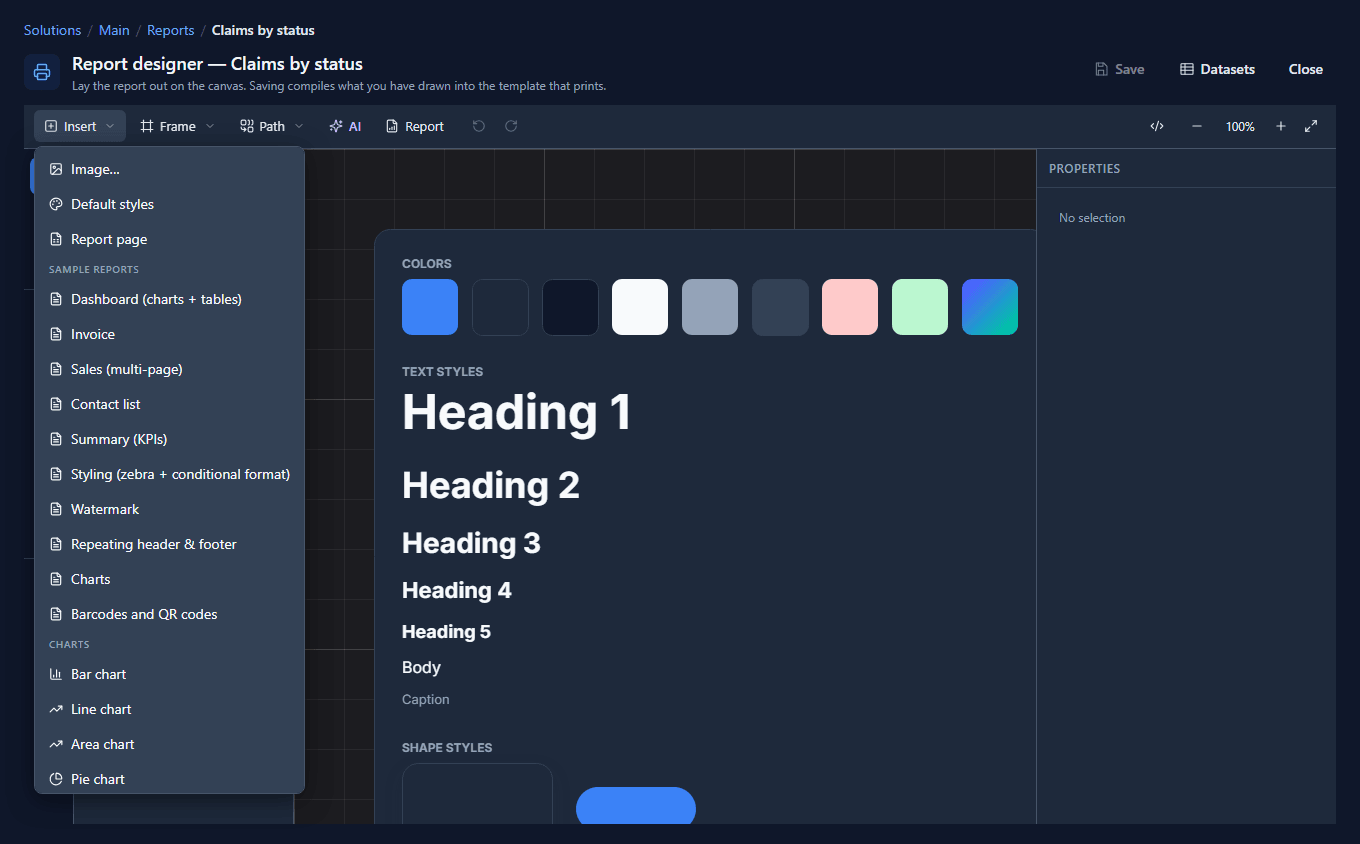
Open Insert. Under it are a blank Report page, finished samples (an invoice, a sales report, a contact list) and charts, barcodes and QR codes:
Report page drops an A4 page beside the Styles board, already holding a page header, a body title, a repeater and a page footer:
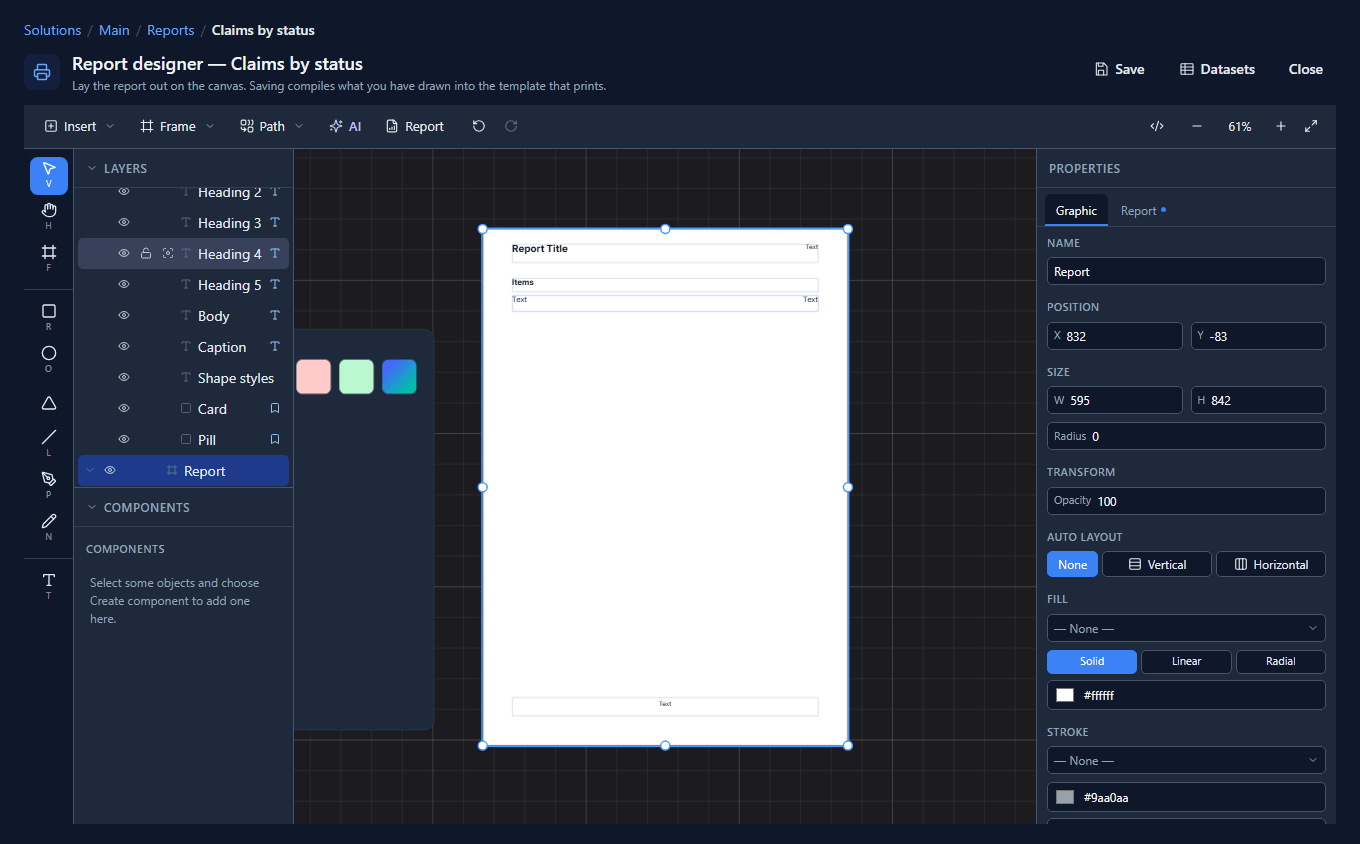
We changed the title to Claims by status and the body title to Claim. The text at the header's right is already bound to the page number, so it stays as it is.
3. One row per claim
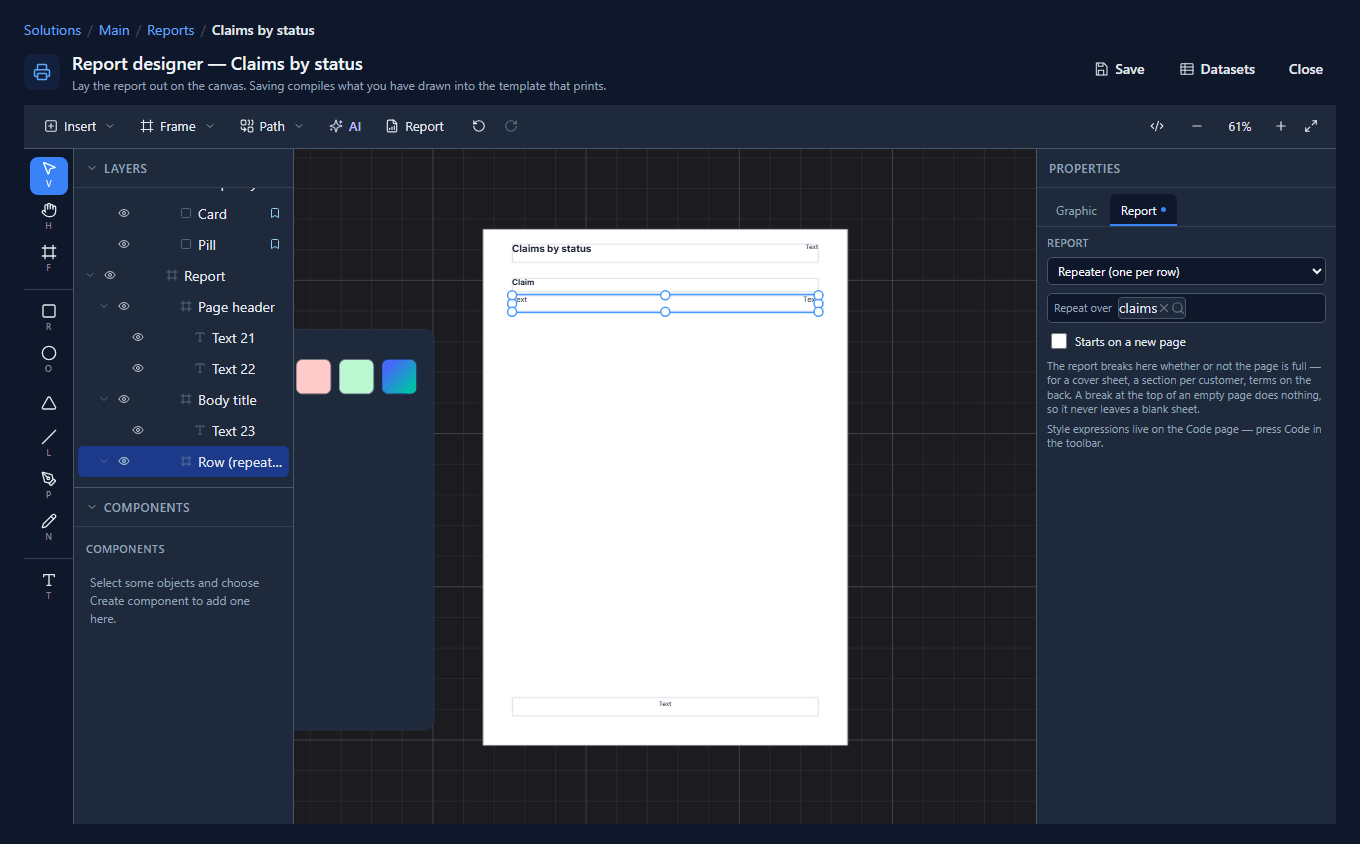
Select Row (repeater) and open the inspector's Report tab. Repeat over is a picker,
and it offers the report's datasets by the names you gave them. Choose claims.
The starter row was bound to a placeholder dataset, rows, so the designer asks first:
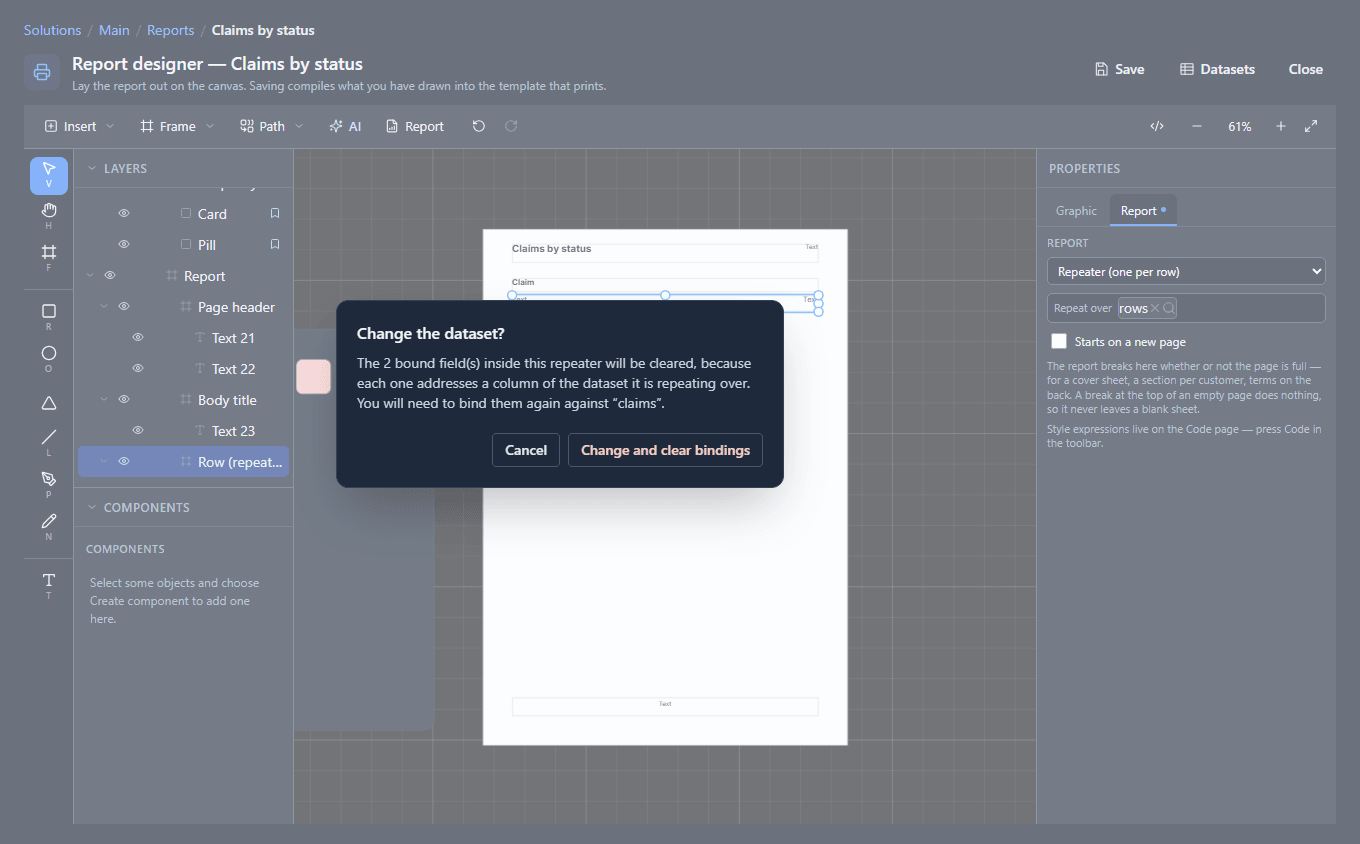
Press Change and clear bindings. The repeater now prints once per claim:
4. Bind the columns
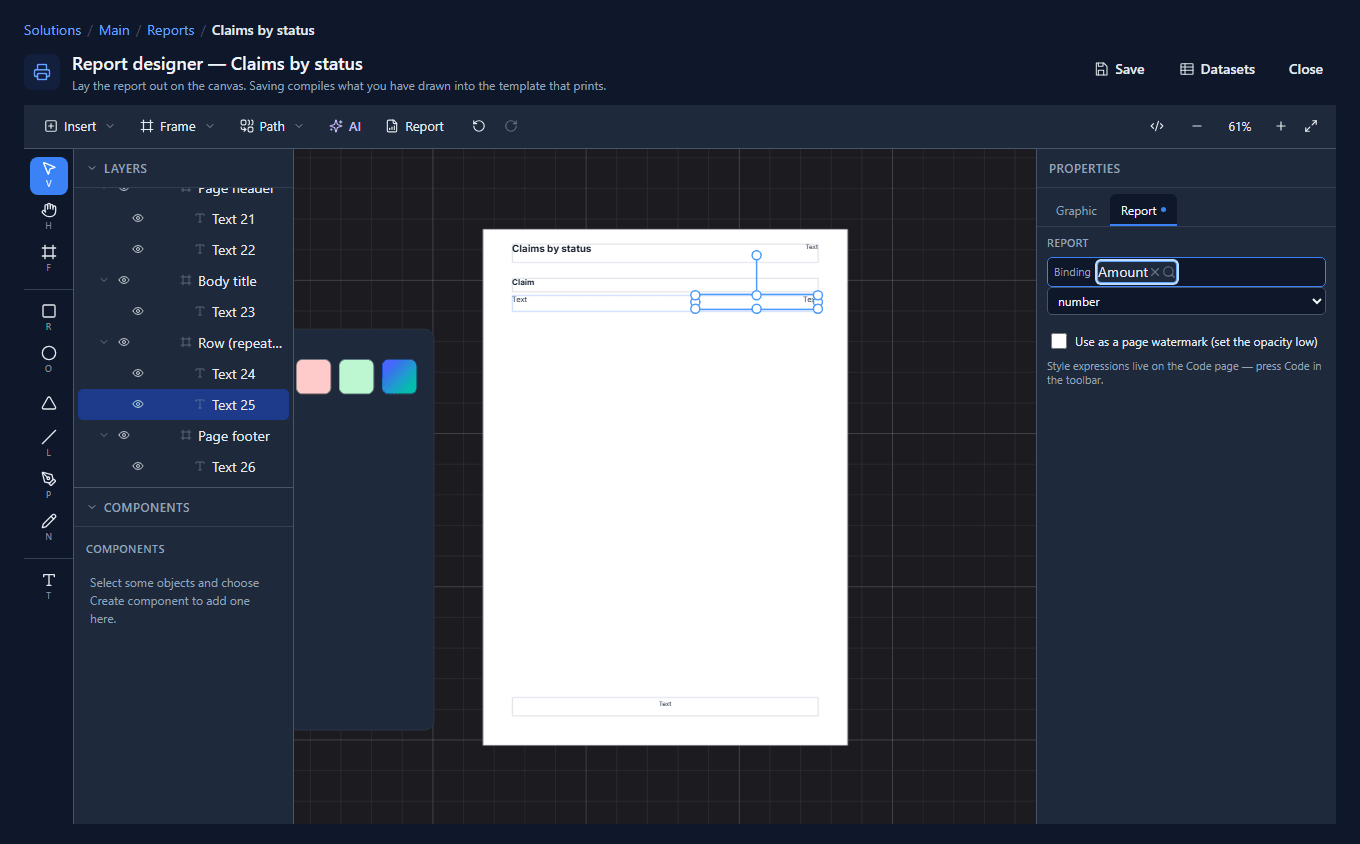
Select the row's first text. On the Report tab, Binding is a picker too, listing the
fields of the claims dataset by their display names. Choose Description (row.par_name).
Select the second and choose Amount (row.par_amount), with Format number, so it prints
with two decimals and the tenant's digits:
For the third column we duplicated the amount cell (Ctrl+D), moved it between the two, and bound it to Status with Format text.
5. Preview with real rows
Press Report in the toolbar. The preview runs the saved query against the environment and lays the page out, here over two pages:
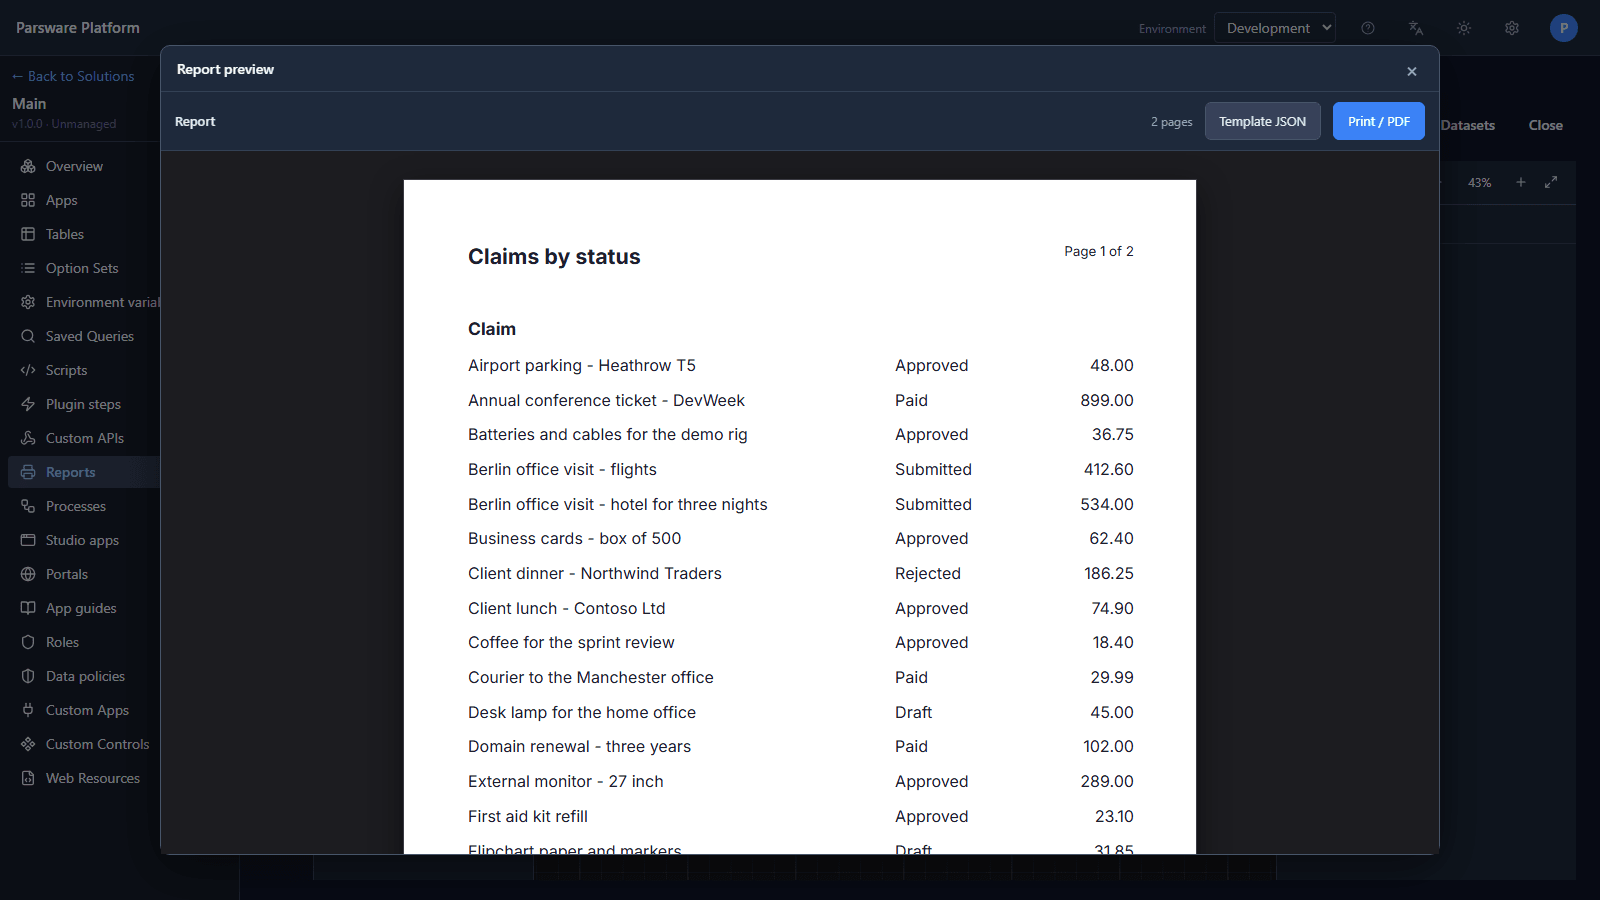
Template JSON shows what the drawing compiled to, and Print / PDF prints it. Close the preview and press Save: the drawing and its compiled template are stored together.
The report is ready, but nobody can open it yet: a report is reached deliberately, from an app's navigation or from a button, never just because it names a table. Putting it in an app comes later in this series.
What we fixed
Building this turned up a problem, now fixed:
- Insert → Report page seemed to do nothing. On a new report the page is placed clear of the Styles board, which at 100% put it mostly outside the view: it was selected somewhere off to the right, and the canvas looked unchanged. The view now moves to show the new page. The help page also said a new report opens on an empty canvas; it says the Styles board is there.
Try it
Import the Expense Reporting sample (reporting-expense-claims) and its expenses.csv, and
make your own report over its saved query. Or open its Expense claims report in the designer
and compare: same dataset, with column headings and a total band.
Next: bands and sections.