Parsware Platform
A report that prints exactly as designed
Why reports in Parsware are drawn rather than generated: a page laid out on a canvas, filled by a saved query when somebody presses Print, paginated, printed one to one on the paper it was designed for, and still text you can select and search.
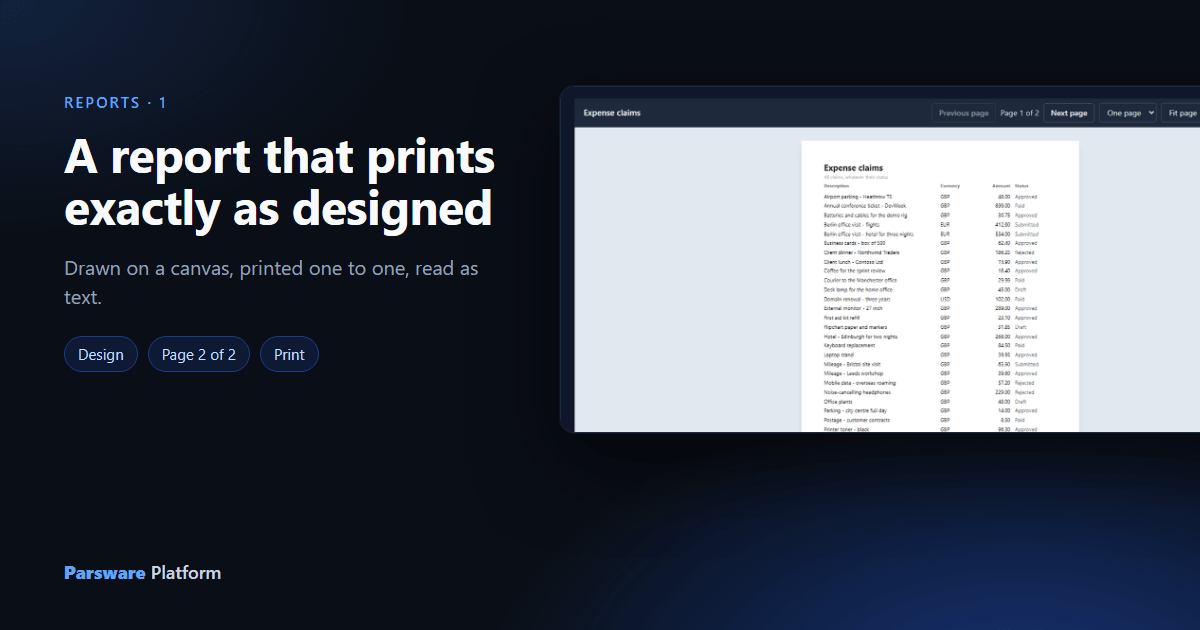
A list on screen and a page on paper are different things. A list can scroll, resize its columns and change its sort; a page can't, and the person holding it doesn't care what the screen looked like. An invoice, a budget position for a meeting, a claim form somebody signs: these have to come out the same every time, on the paper they were designed for.
That's what a report is in Parsware: a page you draw, filled with rows when somebody presses Print.
A drawing, filled with rows
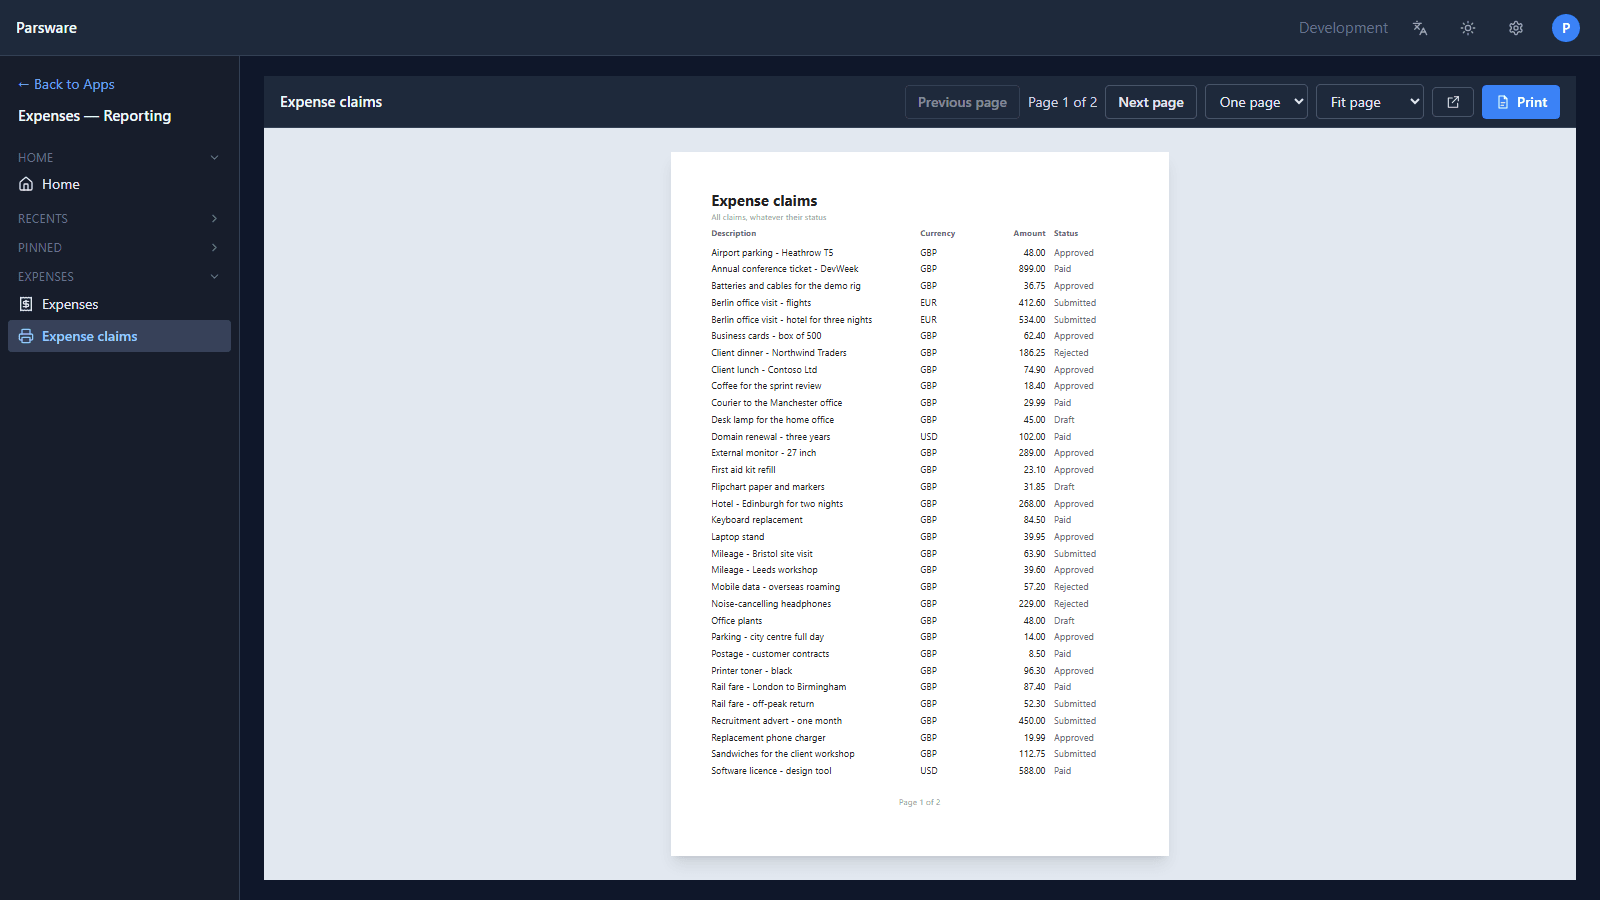
Here's the Expense Reporting sample's report (reporting-expense-claims), opened from its
app's navigation:
And here's the same report in the designer, on the same canvas Studio screens are drawn on:
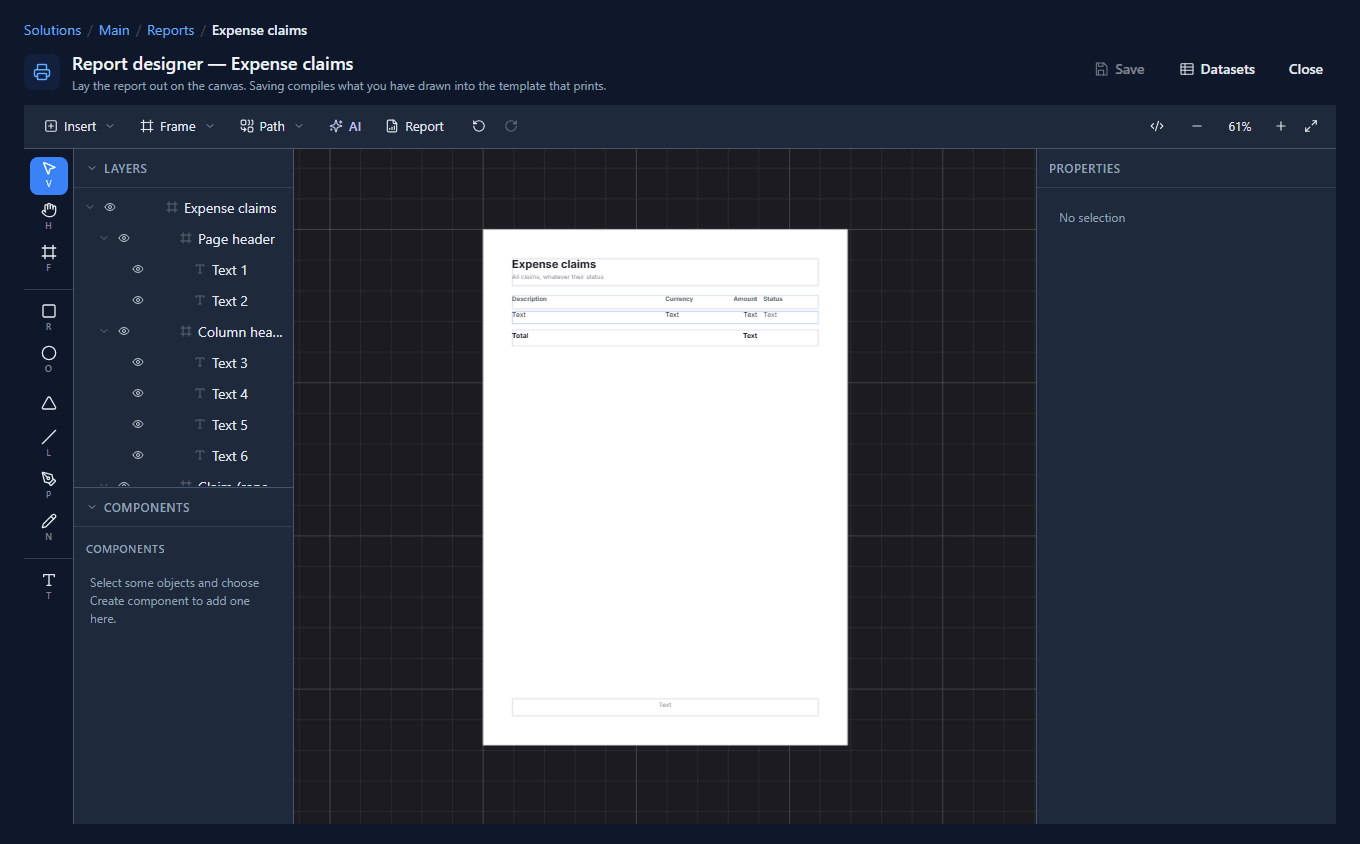
The drawing is made of a few kinds of thing:
- A page, the size of the paper. This one is A4.
- Bands: a page header and a page footer drawn on every sheet, and column headings that come back wherever the table continues.
- A repeater, drawn once and printed once per row of its dataset.
- Bound text:
row.par_amountin the repeater,sum(claims, 'par_amount')in the total,Page 1 of 2in the footer.
Saving does two things: it keeps the drawing, so Design opens the layout you left rather than a reconstruction of it, and it compiles the drawing into the template the report engine prints.
It paginates
Forty claims don't fit on one sheet. The repeater carries on onto the next one, the header and the column headings come with it, and the total is printed once, after the last row:
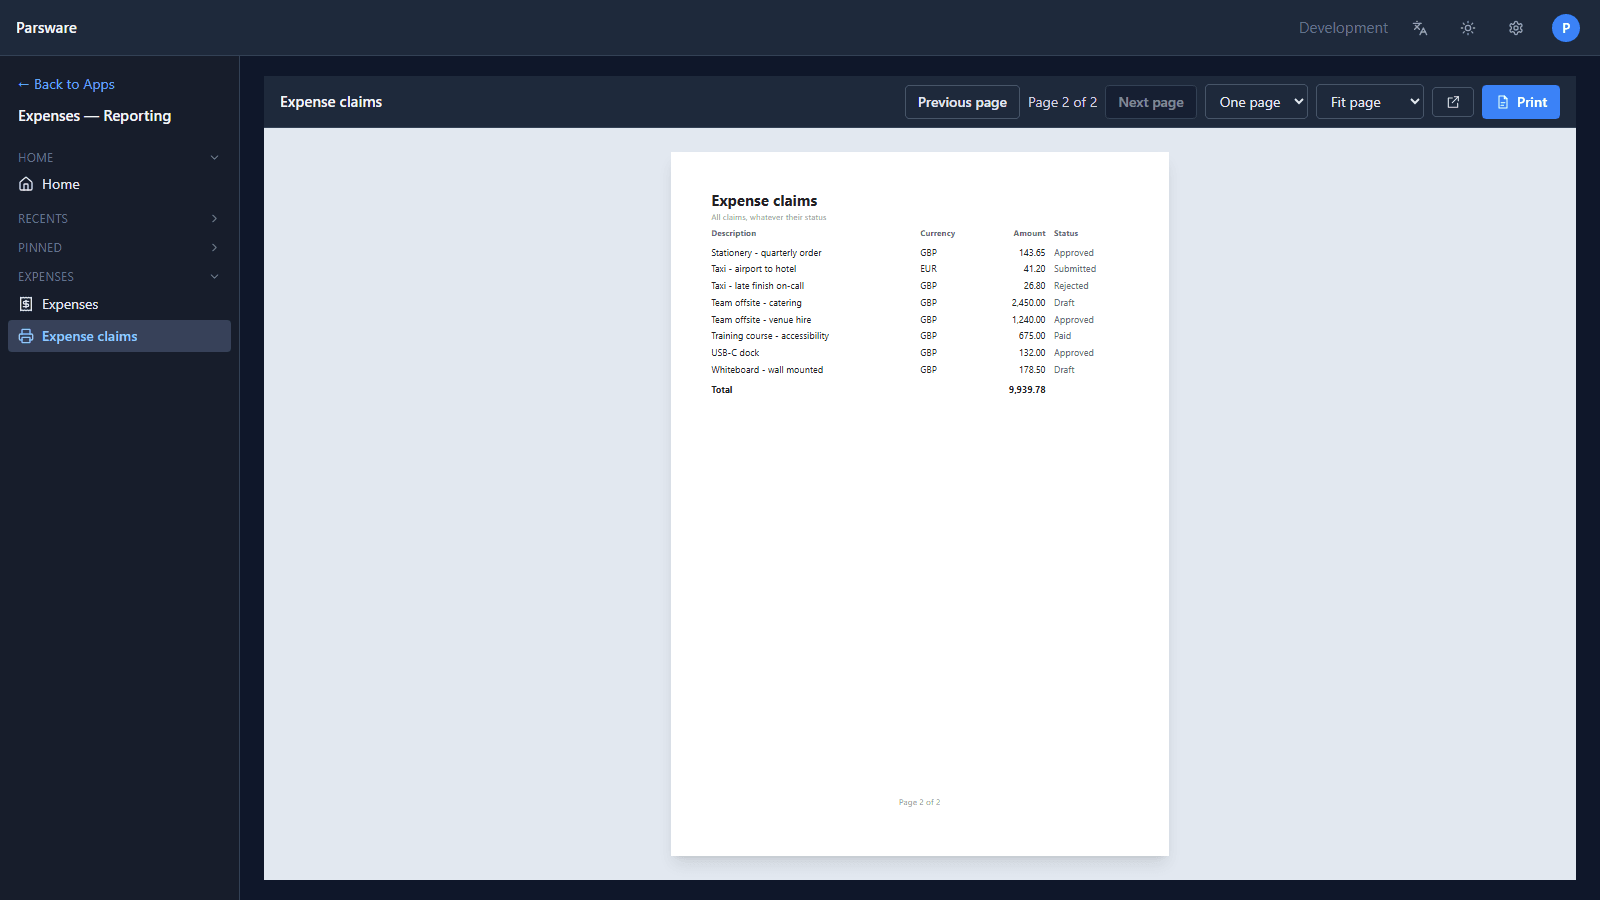
One page design, as many sheets as the rows need. The footer counts the whole report: somebody holding a sheet wants "2 of 2".
It prints one to one
Print prints every page at full size, on the paper the report was designed for, with none of the viewer's buttons and no browser header, footer or URL in the margin. This is the same report through the print stylesheet:
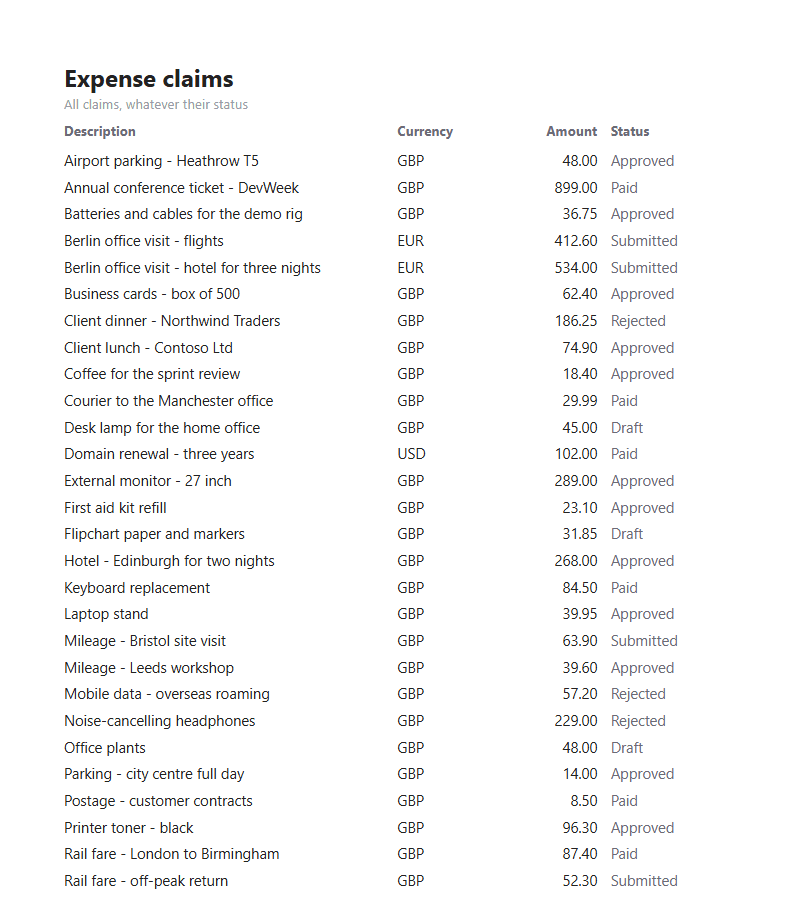
What you drew is what comes out of the printer. If your browser's own print dialog has Headers and footers switched on you'll still get them, because that setting is yours.
It's text, not a picture
A report page is ordinary text on the page. You can select a line and copy it, your browser's Find searches it, and a screen reader reads it:
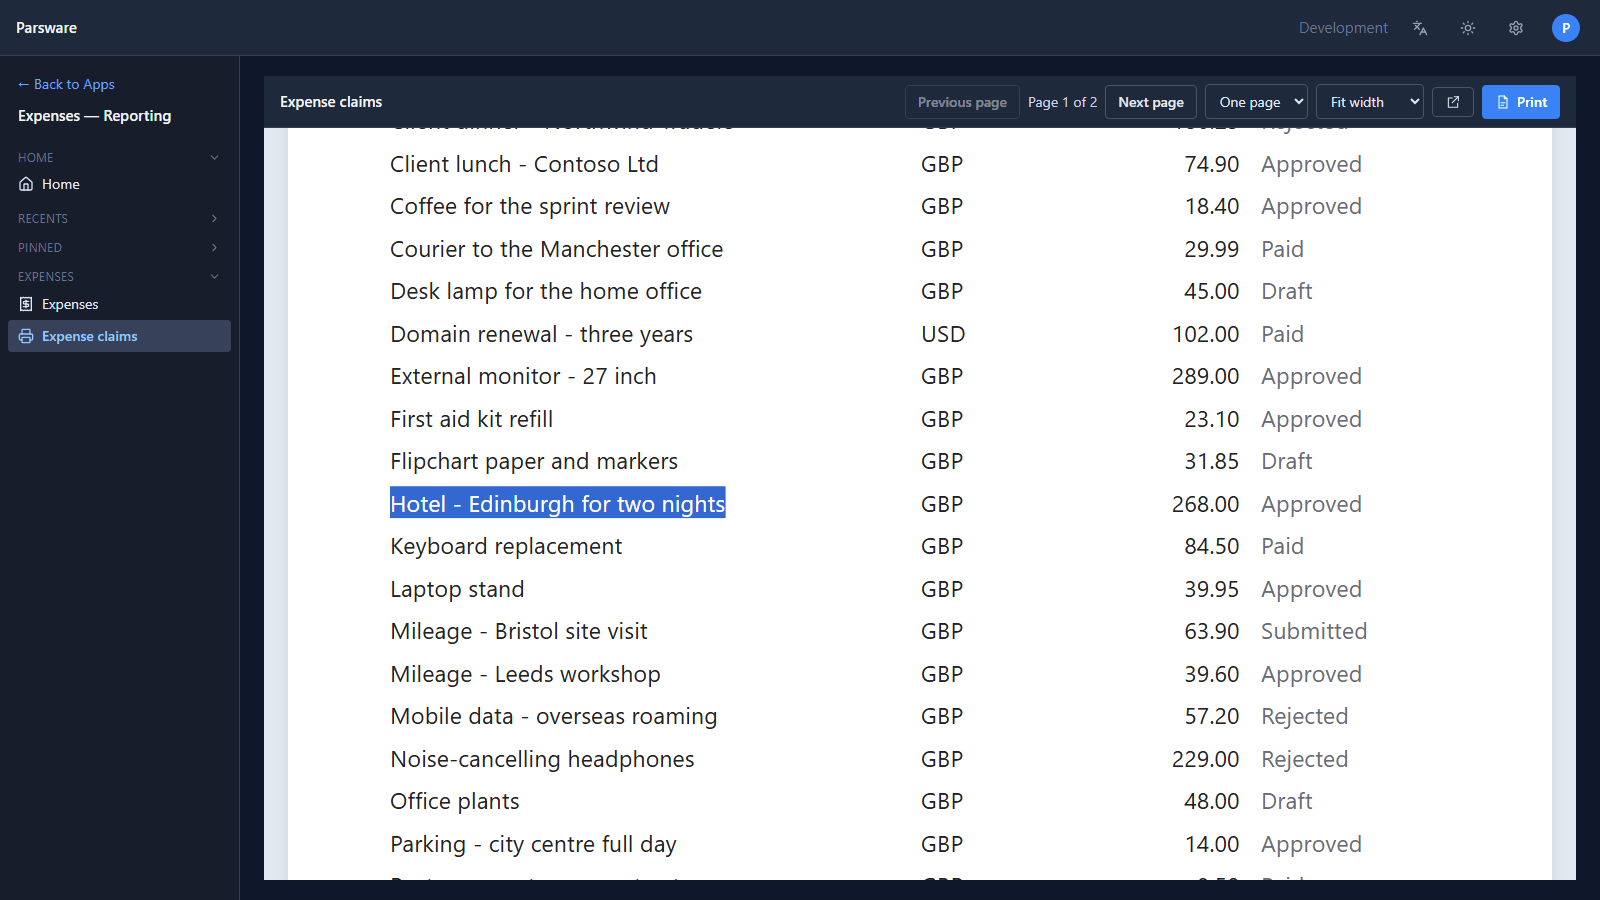
That's also what makes Persian and Arabic lines come out right when they contain a product code or a price: the browser orders the mixed text itself. Dates and digits follow the tenant's calendar and locale, the same as the grid beside the report.
It carries no data
A report is a question and a layout, never a snapshot. Its rows come from a saved query, run when somebody opens it, under their permissions. Two people printing the same report see the records each of them may read. And because the query is saved on its own, a dashboard or another report can ask the same question without a second copy of it.
Where a report fits
| You want | Use |
|---|---|
| Rows to scroll, sort and filter | A view |
| A screen people work on | A form or a Studio screen |
| A page to print, send or sign | A report |
A report opens from an app's navigation, from a button on a record or a list (Run a report), and from a task: in Approval by amount the Capital Investment Group's task opens a report rather than a form, because their decision is a reading act.
What this series covers
- A report that prints exactly as designed (this one).
- Creating a report and binding it to a table.
- Bands and sections: headers, detail rows, footers and page breaks.
- Groups and totals.
- Expressions, number and date formats, and conditional styles.
- Charts that render the same on screen and on paper.
- Barcodes and QR codes.
- Paper, margins and printing.
- An invoice, from an order and its lines.
- A report inside an app, from the navigation and from a record.
- Reports fed by a saved query.
- A report in Persian, right to left, with Persian dates and digits.
Try it
Import the Expense Reporting sample (reporting-expense-claims). Open the expense list, press
Import data and choose the sample's expenses.csv for forty claims. Then open Expense claims
from the app's rail, and press Design on it in the maker portal to see the drawing behind it.
Next: creating a report and binding it to a table.