An executive one-pager
One page for a manager: three figures, the totals by status and the monthly trend, all from FetchXML aggregates Dataverse adds up.
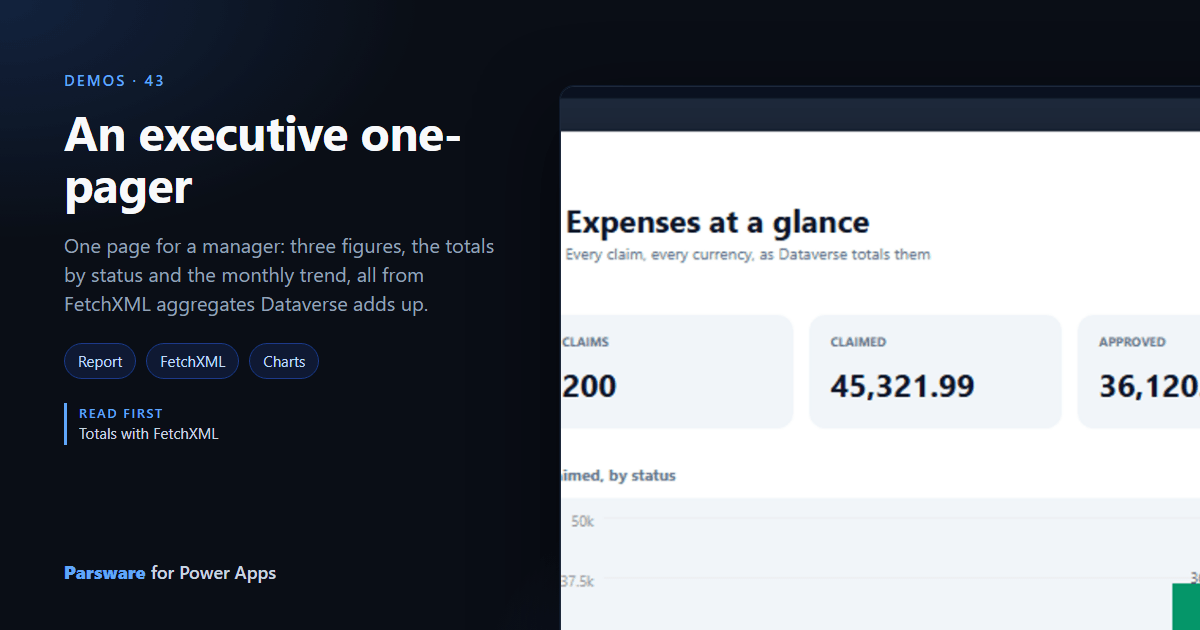
A manager wants one page: how much, how many, and which way it is going. This demo is one, from two FetchXML aggregates: Demos → Executive one-pager.
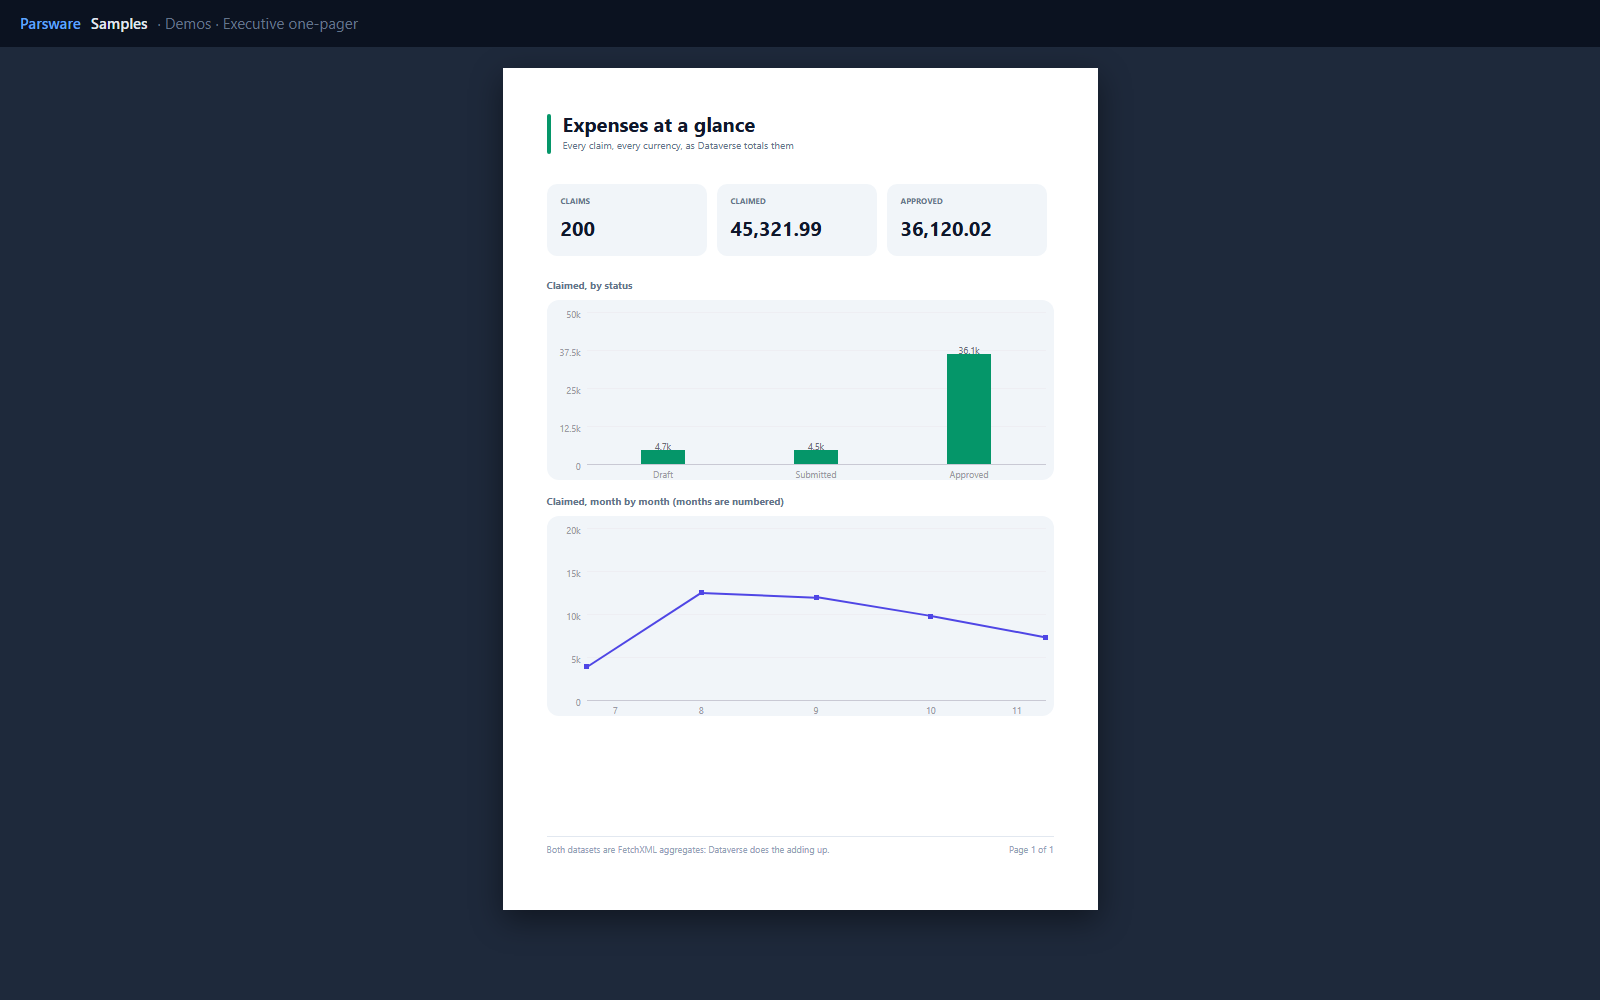
Dataverse adds it up
Both datasets are pasted FetchXML (Totals with FetchXML). One sums and counts the expenses by status:
<attribute name="par_status" alias="par_status" groupby="true" />
<attribute name="par_amount" alias="total" aggregate="sum" />
<attribute name="par_expenseid" alias="claims" aggregate="count" />
and the other sums them by year and month of their date. The report only arranges what comes back.
The three figures read the first one: sum(byStatus, 'claims'),
sum(byStatus, 'total'), and the approved total with
sum(where(byStatus, 'par_status', 'Approved'), 'total').
Two charts
The bar chart is pluck(byStatus, 'total') against the statuses. The trend is a line over
pluck(byMonth, 'total'). A report chart is a bar or a line, so the share by status is bars
rather than a donut.
Try it
- Install the three Parsware for Power Apps solutions, samples included (Install it).
- Open Sample data and press Replace, so the newest columns are filled (The samples, and sample data).
- Open Demos → Executive one-pager.
The pictures show the shipped report laid out on demo data by Parsware’s report engine. In Power Apps it opens in the app, from the navigation or a form.