This case’s claims by month
A small bar chart on the case form: how many expenses were claimed against this case each month, counted in Dataverse with a FetchXML aggregate.
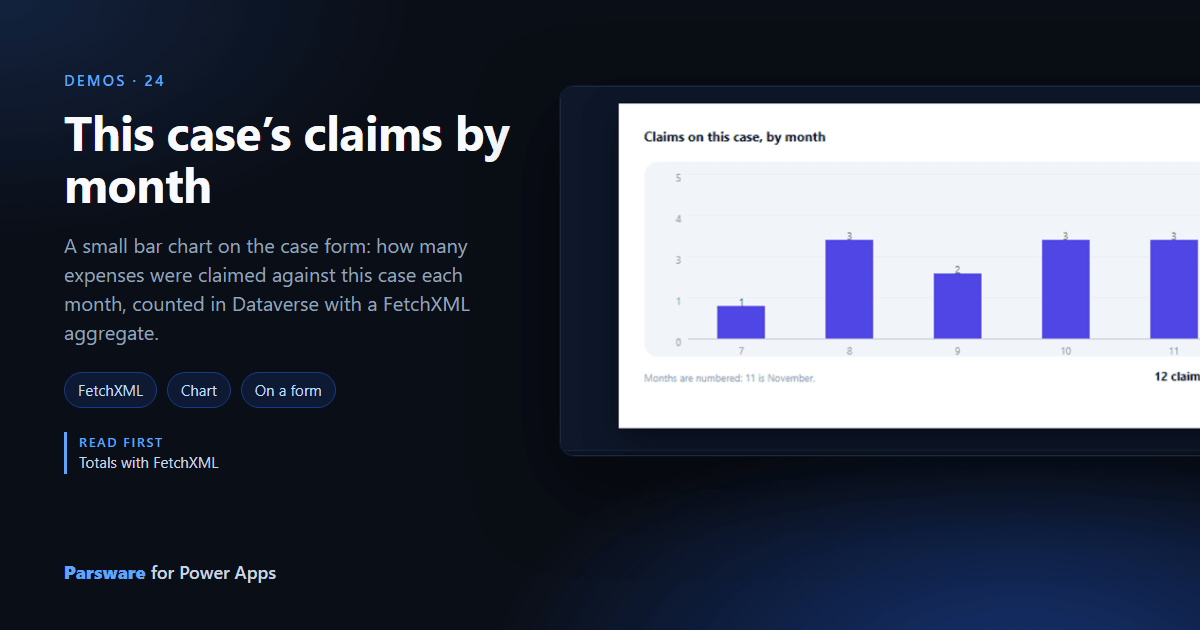
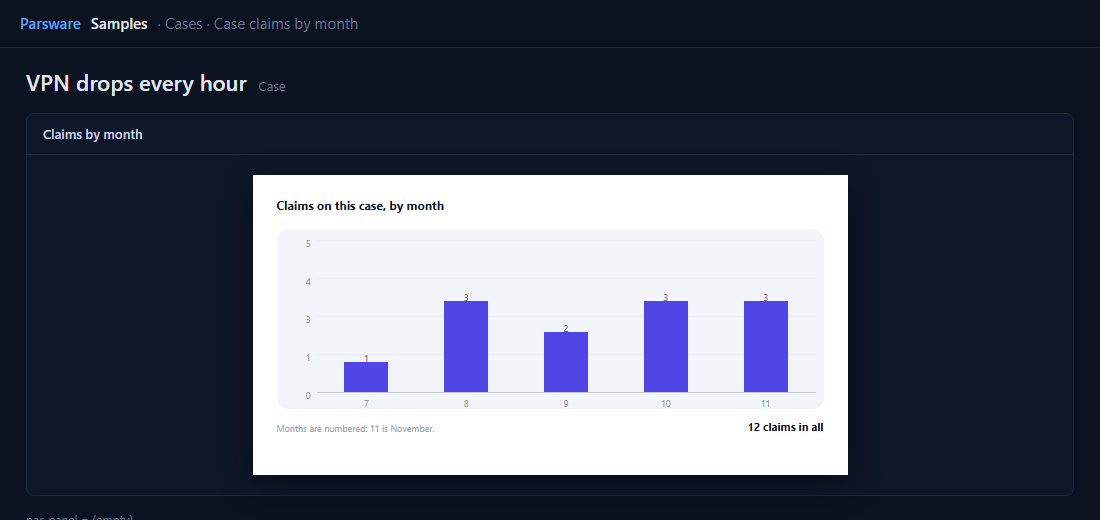
Costs build up on a case over time. This demo charts them on the case form: how many expenses were claimed against this case, month by month.
Expenses have a new Case lookup, so an expense can be a cost of a case. The chart is a report on the Case form (A report on a form).
Dataverse does the counting
The dataset is FetchXML, an aggregate that counts expenses grouped by year and month of their date (Totals with FetchXML):
<fetch aggregate="true">
  <entity name="par_expense">
    <attribute name="par_expenseid" alias="claims" aggregate="count" />
    <attribute name="par_date" alias="year" groupby="true" dategrouping="year" />
    <attribute name="par_date" alias="month" groupby="true" dategrouping="month" />
    <order alias="year" />
    <order alias="month" />
  </entity>
</fetch>
Its recordScopeField is par_case, the lookup back to the case, so on a form the query is
narrowed to the case it is on. The bars are pluck(byMonth, 'claims'), the labels
pluck(byMonth, 'month'), and the total sum(byMonth, 'claims').
It counts claims rather than adding up money because the sample expenses are in three currencies, and adding pounds to dollars gives a number that means nothing.
Try it
- Install the three Parsware for Power Apps solutions, samples included (Install it).
- Open Sample data and press Replace, so the newest columns are filled (The samples, and sample data).
- Open one of the older cases. Claims by month is on the Panels tab.
The pictures show the shipped design running on demo data in Parsware’s own runtime. In Power Apps the form, the side pane and the dialog are the app’s own.