A date range as a timeline
Two date columns, when work starts and when it ends, drawn as one bar across a fortnight with the number of days written above it.
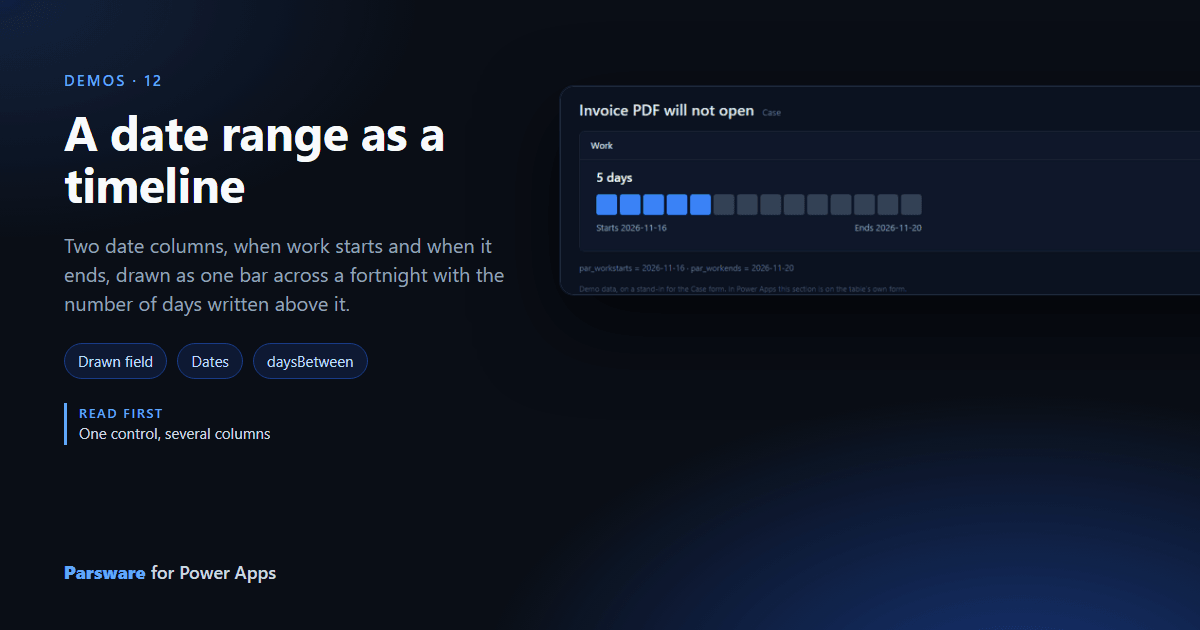
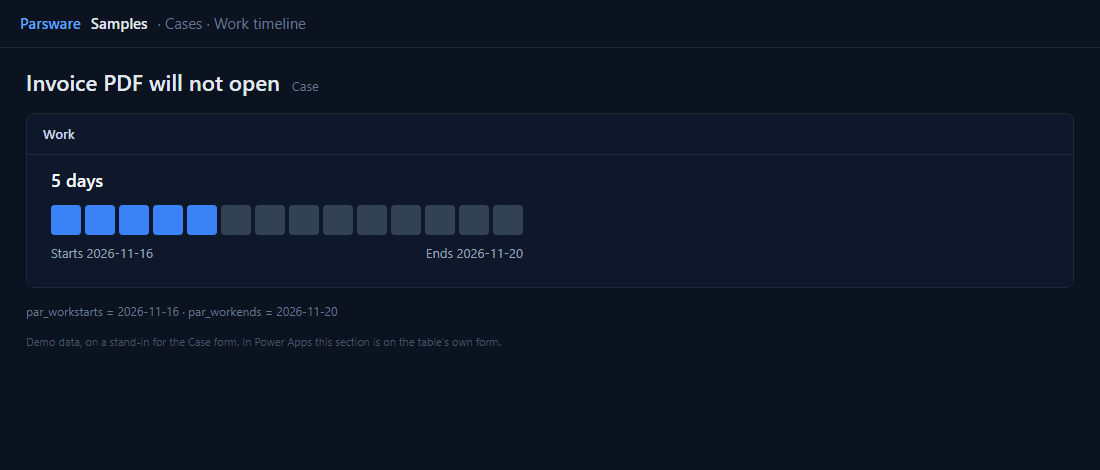
Two date boxes don’t show how long something takes. This demo draws Work starts and Work ends on a case as one bar across two weeks, with the number of days above it.
The control sits on Work starts and is bound to Work ends as its second column.
Counting days
A new function, daysBetween(from, to), counts whole calendar days, so the length (both ends
included) is:
daysBetween(field.value, fields.par_workends) + 1
Each of the fourteen boxes has a blue copy, shown when that length is more than its position, so
the bar is as long as the job. A plain date, written 2026-11-16, is counted as that day,
whatever time zone the reader is in.
A job longer than a fortnight fills every box and says Longer than two weeks underneath.
Try it
- Install the three Parsware for Power Apps solutions, samples included (Install it).
- Open Sample data and press Replace, so the newest columns are filled (The samples, and sample data).
- Open a case. Work is on the Drawn controls tab; change either date on General and the bar follows.
The pictures show the shipped design running on demo data in Parsware’s own runtime. In Power Apps the form, the side pane and the dialog are the app’s own.