A progress ring
A number from 0 to 100 drawn as a ring with the percentage beside it, and two buttons that move it on by ten.
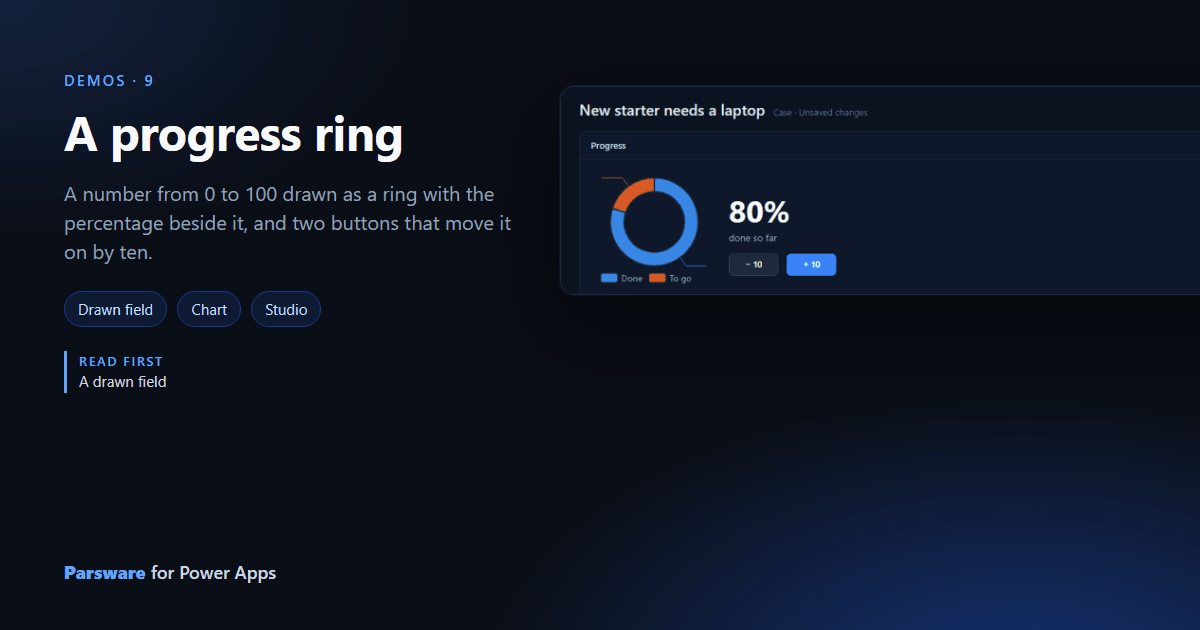
Progress on a case is a number from 0 to 100. This demo draws it as a ring on the Case form’s Drawn controls tab.
It is a drawn field: a Parsware Studio design placed on the column through the Parsware
control, in place of the column’s own control. It reads the column as field.value and writes it
with setFieldValue(...), so the value goes to the form: saved when you save and gone if you
discard, like anything typed into the form.
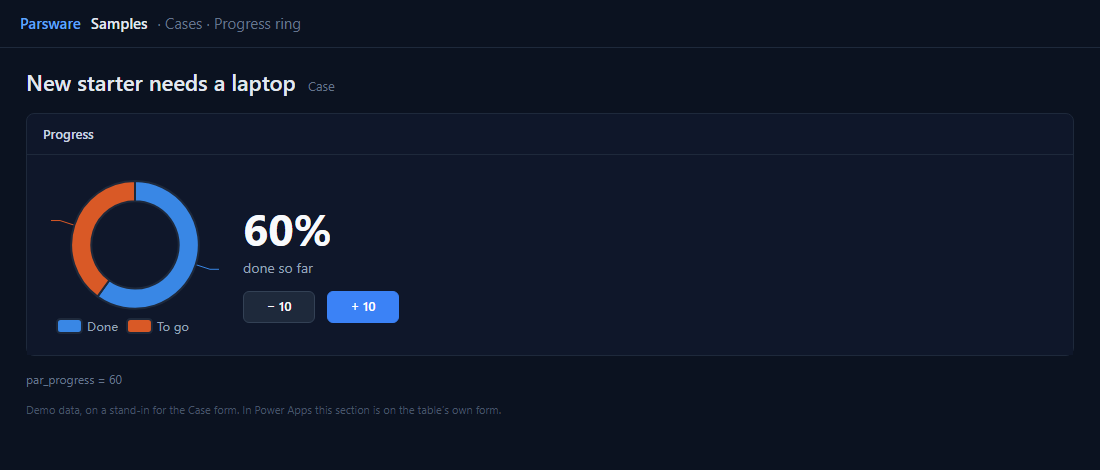
The ring is a chart
The ring is the platform’s chart, set to a donut, bound to two slices worked out from the column:
[{ label: "Done", value: num(field.value) }, { label: "To go", value: 100 - num(field.value) }]
num() turns the column’s text into a number. The big figure beside it is
text(num(field.value)) + "%".
+ 10 adds ten and stops at a hundred:
var v = num(field.value) + 10;
if (v > 100) { v = 100; }
setFieldValue(text(v));
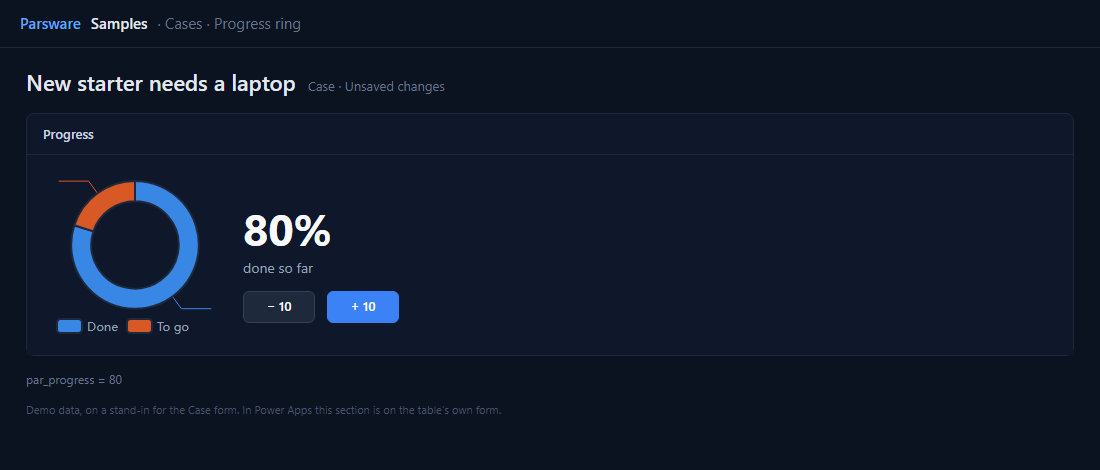
The ring follows the column whichever way it changes: a press here, a typed number in the plain column on the General tab, or a business rule.
Try it
- Install the three Parsware for Power Apps solutions, samples included (Install it).
- Open Sample data and press Replace, so the newest columns are filled (The samples, and sample data).
- Open a case. Progress is on the Drawn controls tab.
The pictures show the shipped design running on demo data in Parsware’s own runtime. In Power Apps the form, the side pane and the dialog are the app’s own.