For Power Apps
Generate a report with AI
Describe a report in a sentence and the Parsware designer draws it, bound to your own Dataverse table. It runs on an AI Builder prompt in your tenant, with no key and no outside service. Here is a case list with a page count, column headings and a total, generated in about twenty seconds, then corrected by hand.
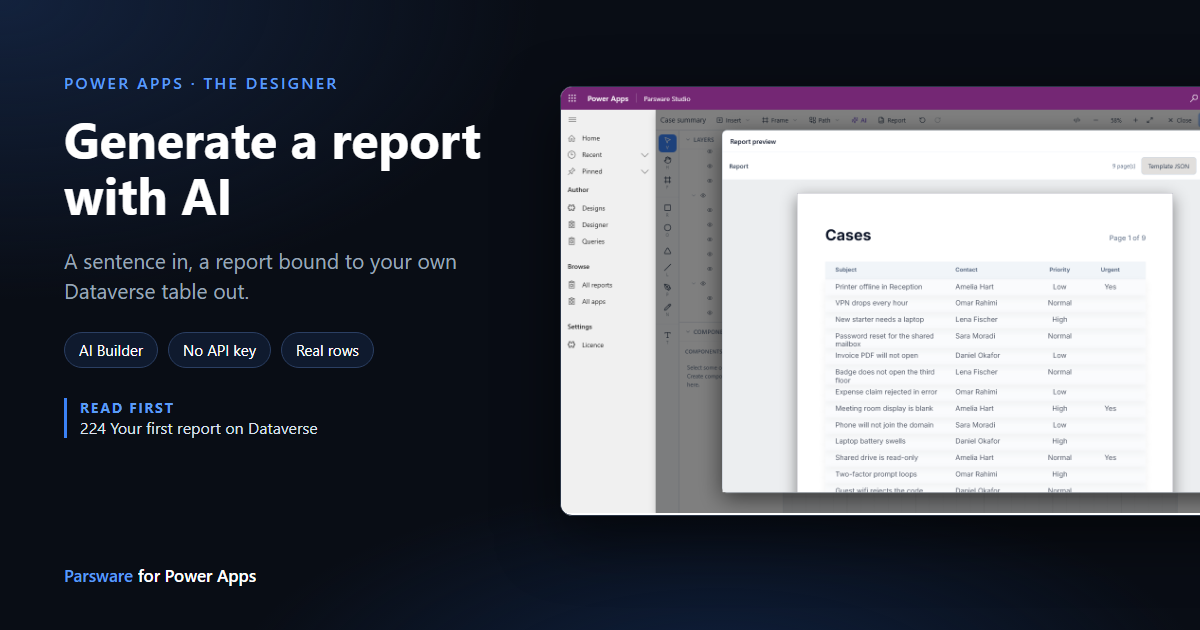
Drawing a report by hand means placing a title, a page number, headings, a repeating row and a total, and binding each one. The designer's AI button does that first draft for you from a sentence, and binds it to your own table's columns. You then change what you want, the same way as any other report.
We'll generate a list of the Case table from the samples, with four columns and a total.
Where the AI runs
The AI button calls an AI Builder prompt that comes with Parsware Studio, Parsware design generation. It runs inside your own environment and is paid from your tenant's Copilot credits. That's about one credit a report. There's no API key to set up, no connector, and nothing sent to a service of ours.
A trial environment has credits already. In production, an administrator adds Copilot credits or a pay-as-you-go plan in the Power Platform admin center. If there are none left, the designer says so.
1. Create the design and give it a dataset
Create a design as in Your first report on Dataverse: Designs, New, a Name (ours is Case summary), Kind set to Report, then Save. Open it in Designer.
Before pressing AI, add the dataset. Press AI in an empty design and it tells you why:
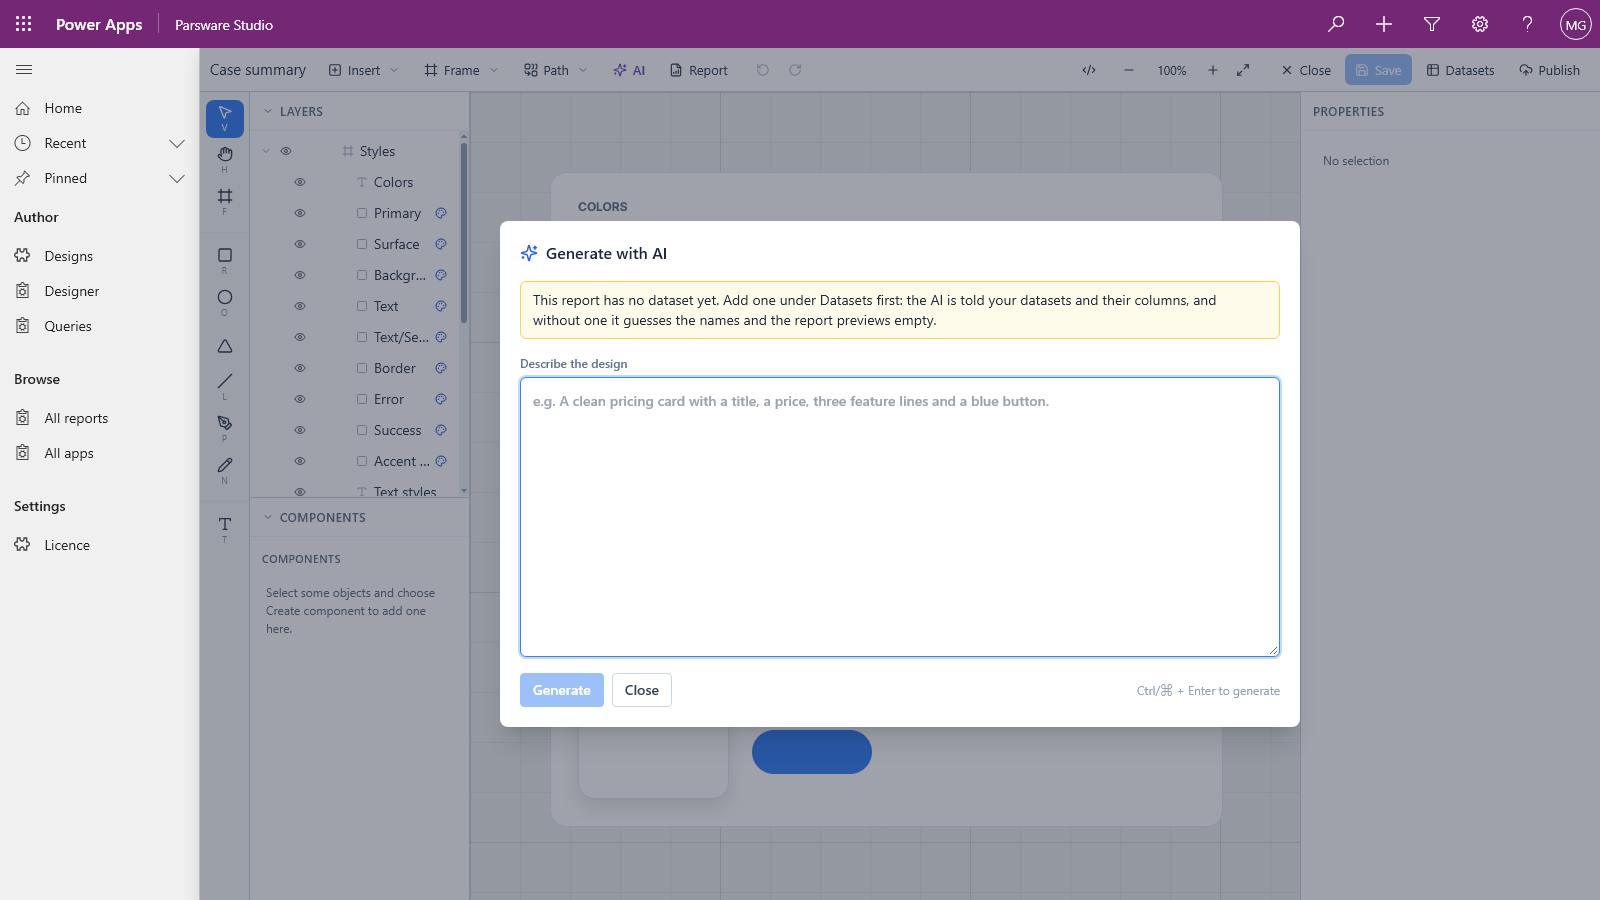
The AI only knows the columns you tell it about, and the dataset is how you tell it. So close the
dialog, press Datasets, add one named cases on the Case table with View left on
Every row, and press Save.
2. Describe the report
Press AI again. The note now names the dataset it will be told about:
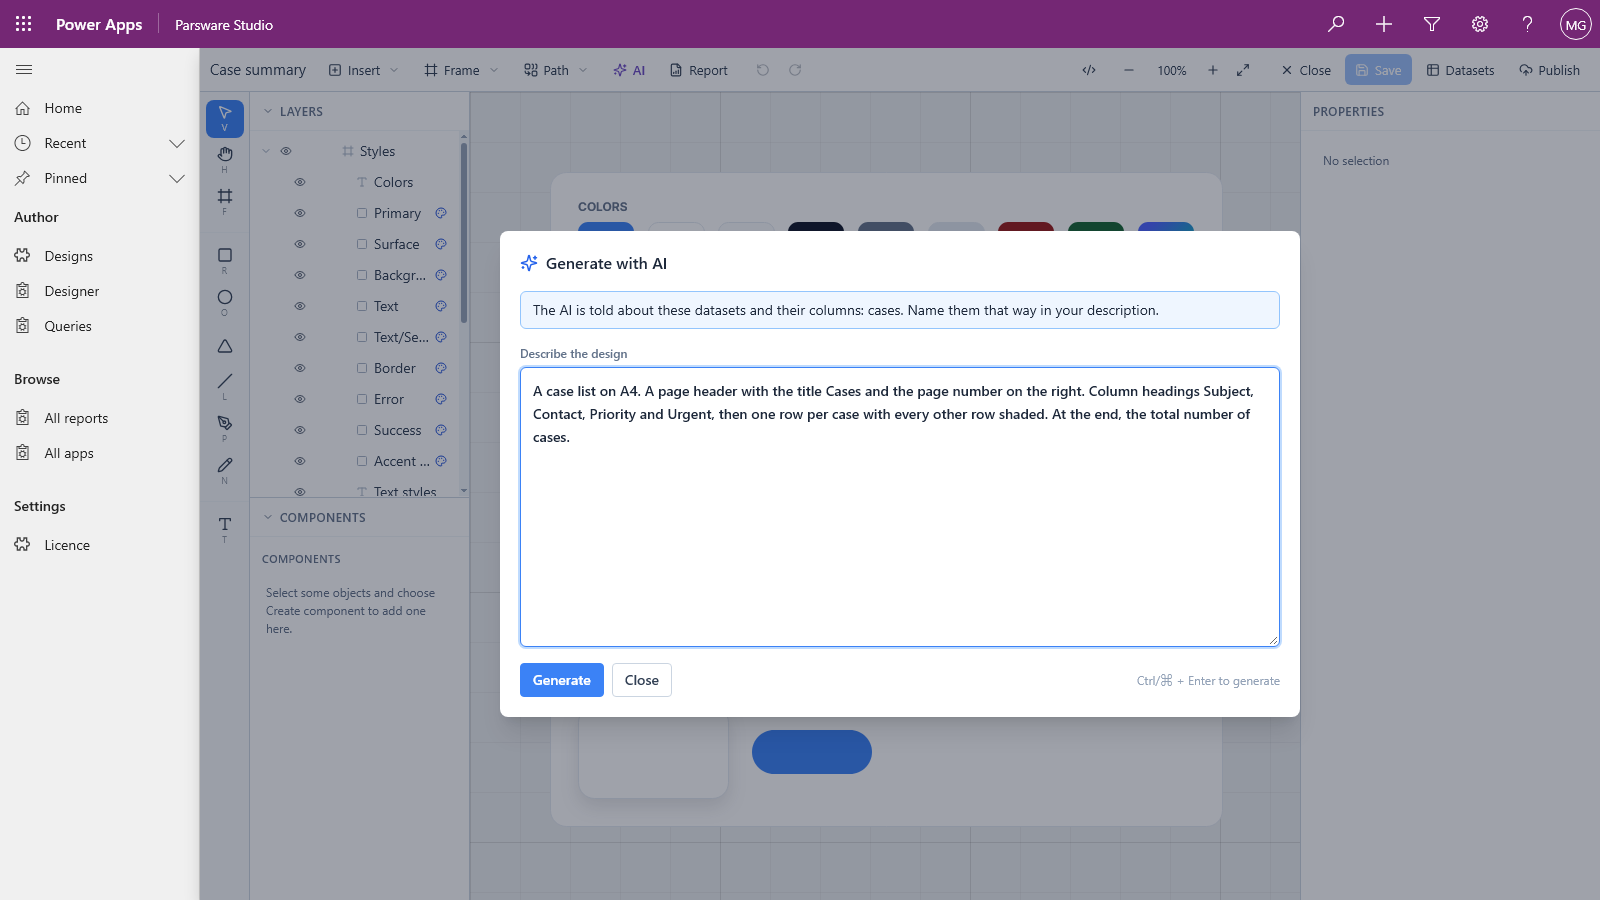
We typed:
A case list on A4. A page header with the title Cases and the page number on the right. Column headings Subject, Contact, Priority and Urgent, then one row per case with every other row shaded. At the end, the total number of cases.
Say what goes on the page, in which order, and which columns. You can name columns as you'd say them (Contact), and the AI matches them against the table's own.
Press Generate, or Ctrl + Enter. Ours took about twenty seconds.
If the first answer isn't a usable design, the dialog says Correcting… attempt 2 of 3. It sends the answer back with what was wrong and asks again, and you don't need to do anything.
3. What it drew
The report is added to the canvas beside what's already there, as a report page with its parts in the layers list: Page header, a Table header, Cases Repeater with one text box per column, and Totals at the end.
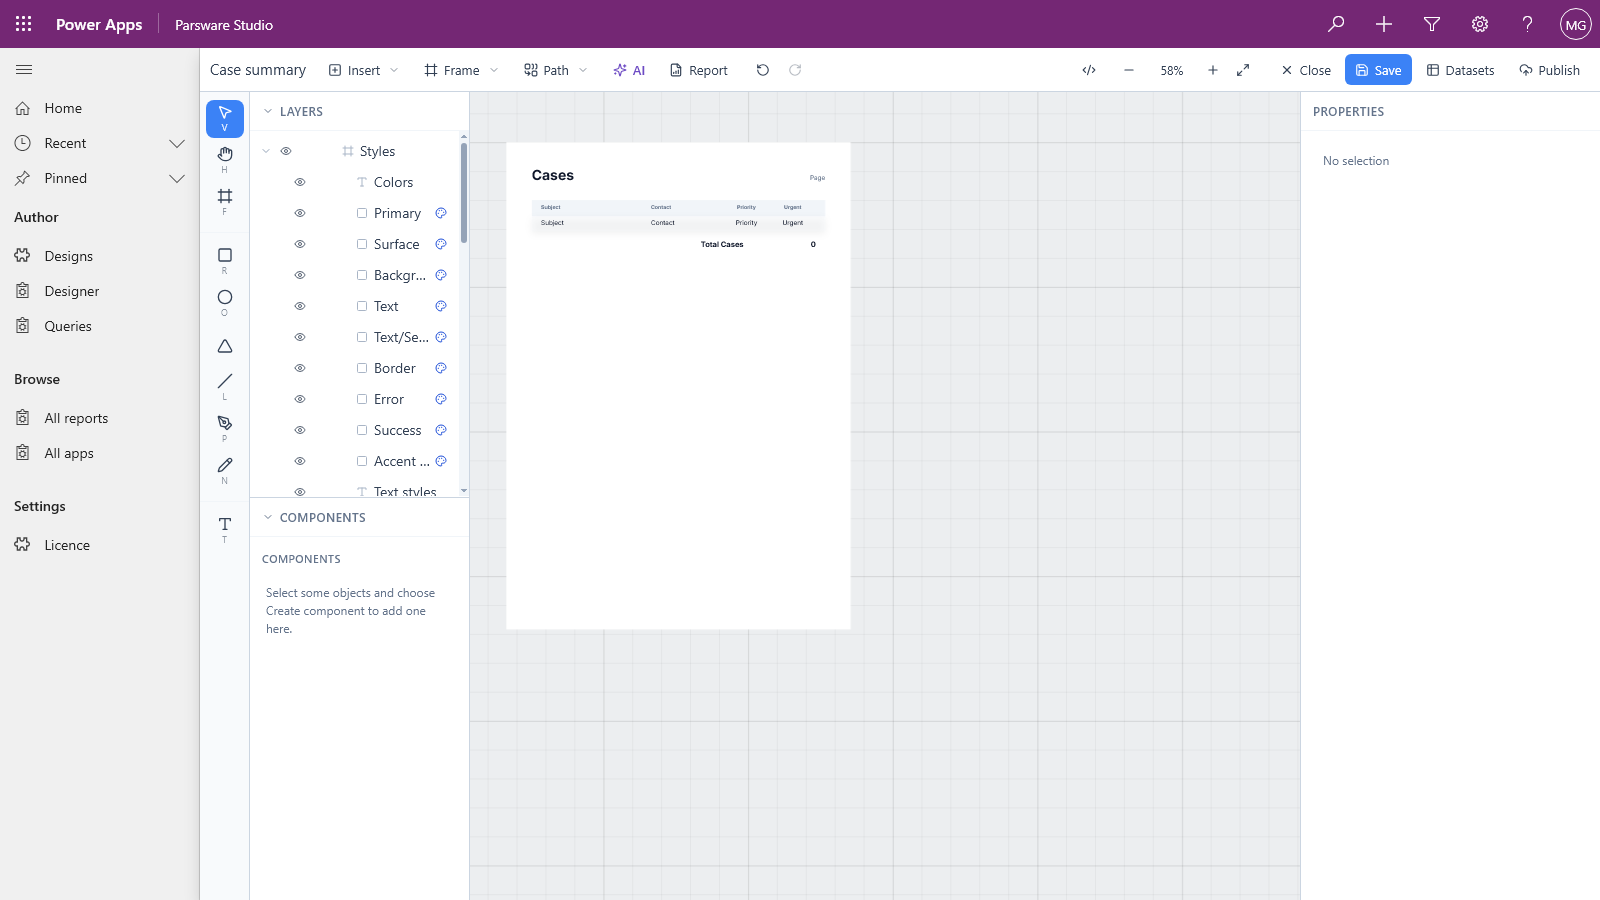
These are ordinary shapes. Select any of them to change it, as in any other report. Nothing is saved until you press Save.
4. Preview it
Press Save, then Report on the toolbar:
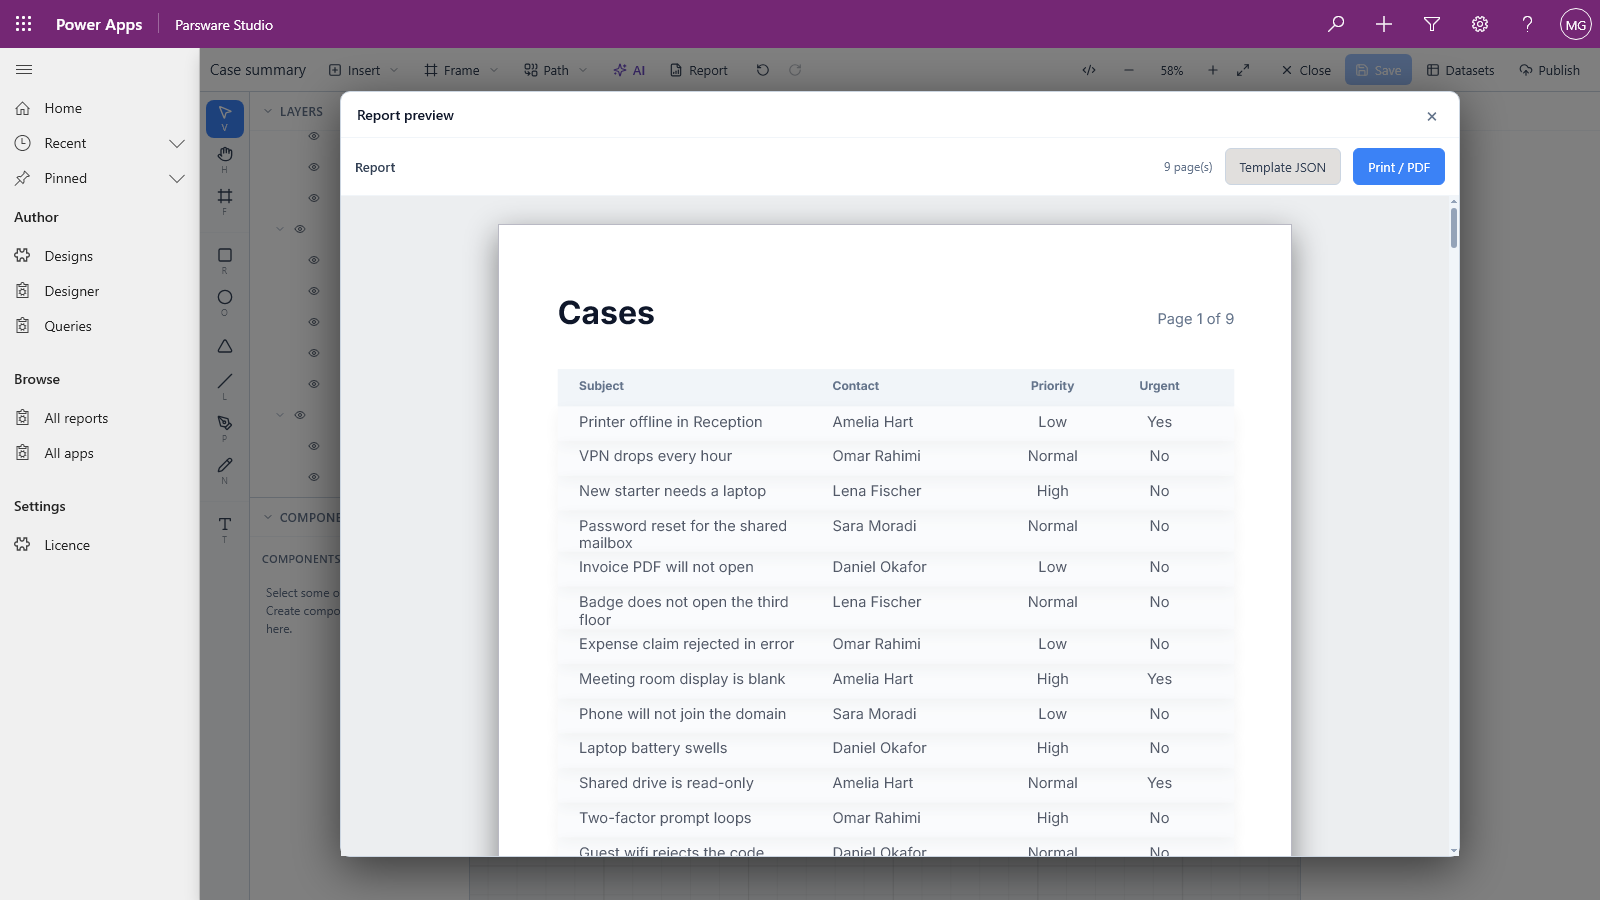
The repeater is bound to cases and each text box to a real column, so it previewed with our 200
cases straight away, nine pages of them:
- Contact prints the contact's name, not an id.
- Priority prints its label, Low, Normal or High.
- Urgent, a Yes/No column, prints Yes or No.
- The page number counts the pages: Page 1 of 9.
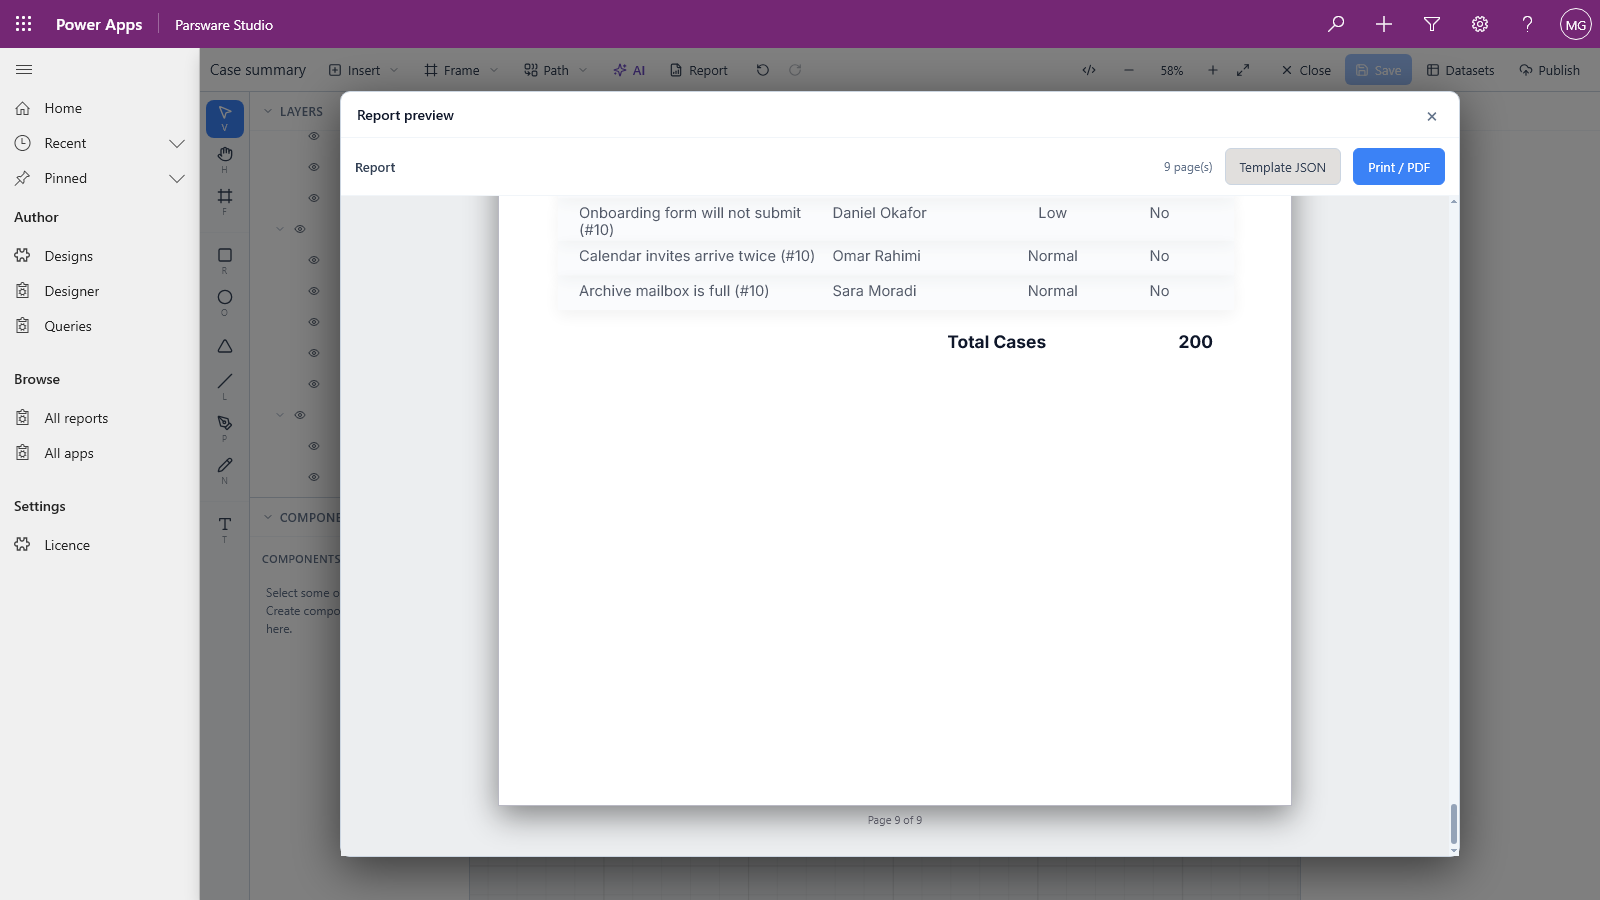
The total comes once, after the last row:
5. Change what you don't like
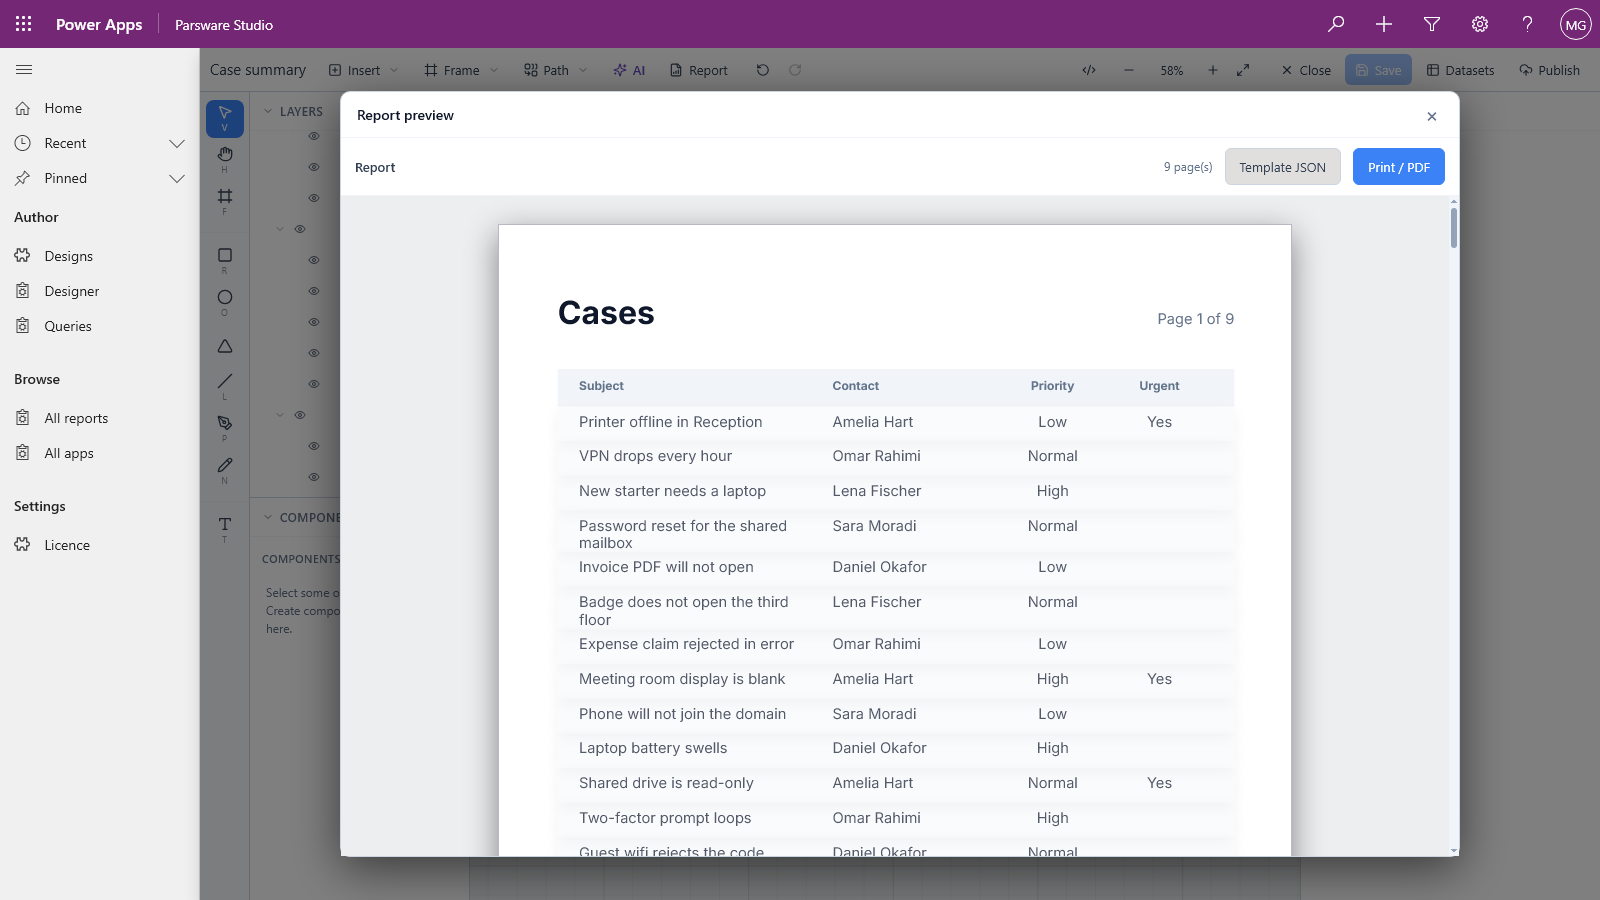
Say a column of Nos is noise, and we'd rather print Yes for an urgent case and nothing for the rest.
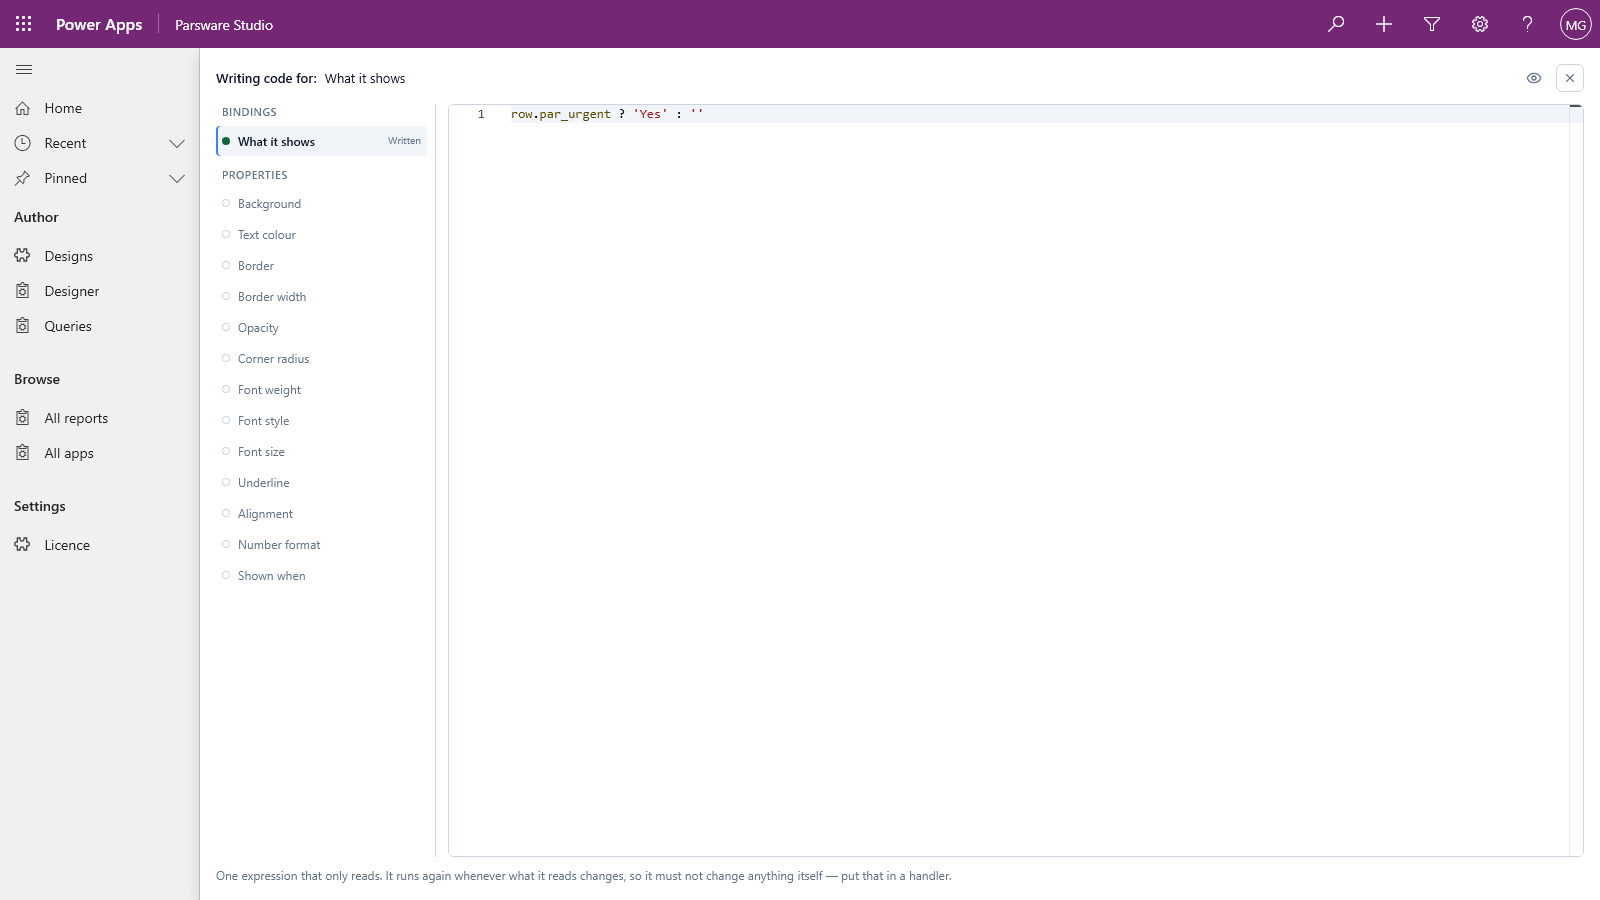
Select the urgent text box in the row (Row Urgent in the layers list) and press </>
(Write code) on the toolbar. Its binding, What it shows, is the column on its own,
row.par_urgent. Replace it with:
row.par_urgent ? 'Yes' : ''
Underneath, the column's value is still true or false, which is what the condition tests. It only becomes a word when it's printed.
Close the code page, Save, and preview again:
The same goes for anything else: a heading's words, a colour, a column's width. Our shading came out very faint, for instance. Select Row background and give it a stronger colour on the Graphic tab.
Good to know
- It always adds; it never changes what's there. Press AI again and you get a second report page beside the first. Delete the one you don't want.
- Tell it about the data first. Add every dataset the report needs before pressing AI, under the names you'll use in your description. If the AI still repeats over a dataset the design doesn't have, the dialog names it, because that report would preview empty.
- Check the preview, not just the canvas. The canvas shows placeholders. The preview shows what the bindings print.
- It's a draft, and yours. Save it, publish it and move it between environments like any other report (see Publish: drafts versus what users see).
Next
The next series is Deploying and licensing, starting with moving designs from development to production through your own solutions. The whole series is in the reading list.