Parsware Platform
Design a query
A saved query in Parsware is a question your solution owns. Build one in the query designer from a table, the tables joined to it, the columns it returns and the conditions that narrow it, and every save is checked against the environment's real tables before anything can use it.
A view answers one question about one table: which contacts, in which order, with which columns. A saved query answers questions a view can't: contacts together with their account, filtered by something only the account knows. It is also shared. Once saved, the same query can feed a report, a script or a custom app, instead of each one keeping its own copy.
This article builds one in the query designer: contacts at accounts with 1,000 employees or more, with the account's name, city and size beside each person. We used the Account and Contact tables every environment starts with, and a solution of our own called Sales. Every picture is the real product.
Start a query
Open your solution, choose Saved Queries, then New. The designer fills the page. Give the query a display name and a description, then choose its table. Everything else is built from that table and the tables joined to it. We chose Contact:
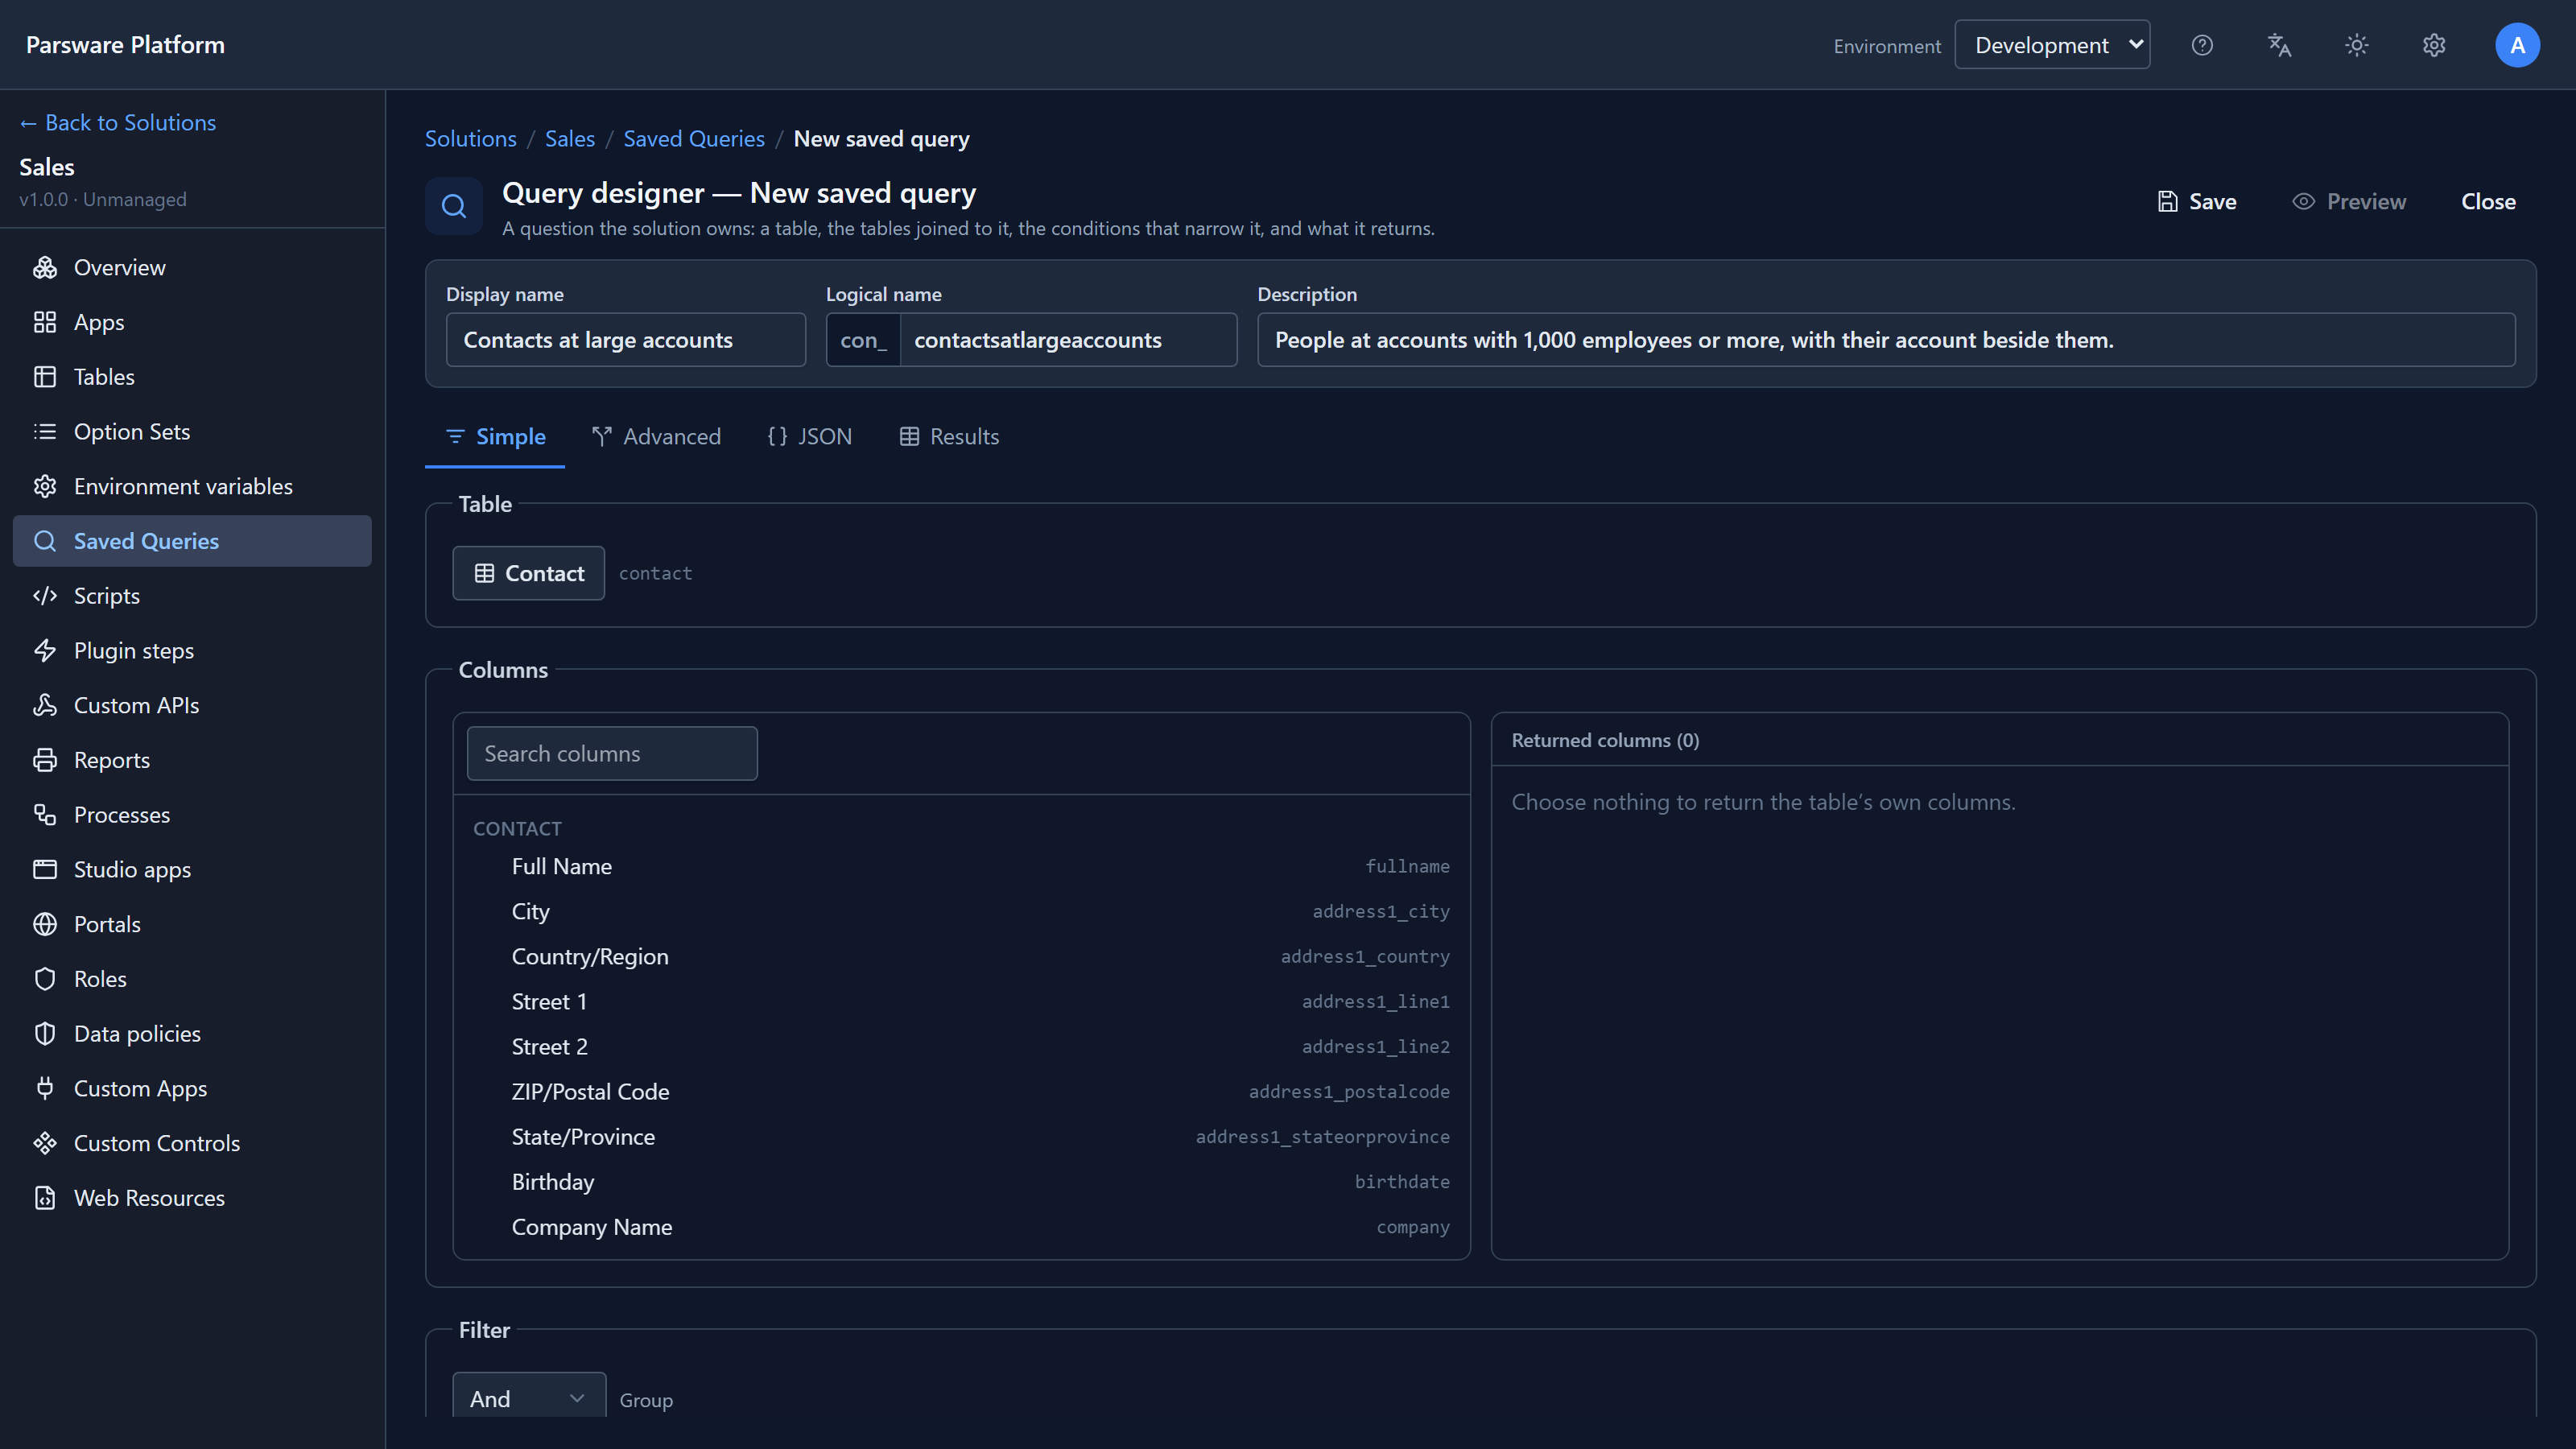
There are four tabs, all showing the same query:
- Simple: a table, its columns, a filter, a sort and a row limit.
- Advanced: all of that, plus related tables, grouping and options.
- JSON: the query as a document.
- Results: what the query returns.
Change something on one tab and the others show it, so they can't disagree. We work on Advanced, because we want a related table.
Join the account
Choose Add related table. The list comes from the relationships your environment already has, so you never type a field name. Each entry says which way the join goes:
- one related record: following a lookup, here the contact's account. This is the usual join.
- many related records, can repeat rows: the other way round, such as a contact's assets. The contact then comes back once per asset, which is how a total ends up counted twice. Use it when you mean it.
We chose Account, one related record. It gets a name, account, and a join setting. Keep rows with no match (the default) keeps a contact who has no account. Only matching rows drops them, silently, so keep the default unless you want that.
Choose the columns
The left pane lists every column the query can return: the contact's own, then the account's. Type to search it, and tick a column to add it to Returned columns on the right:
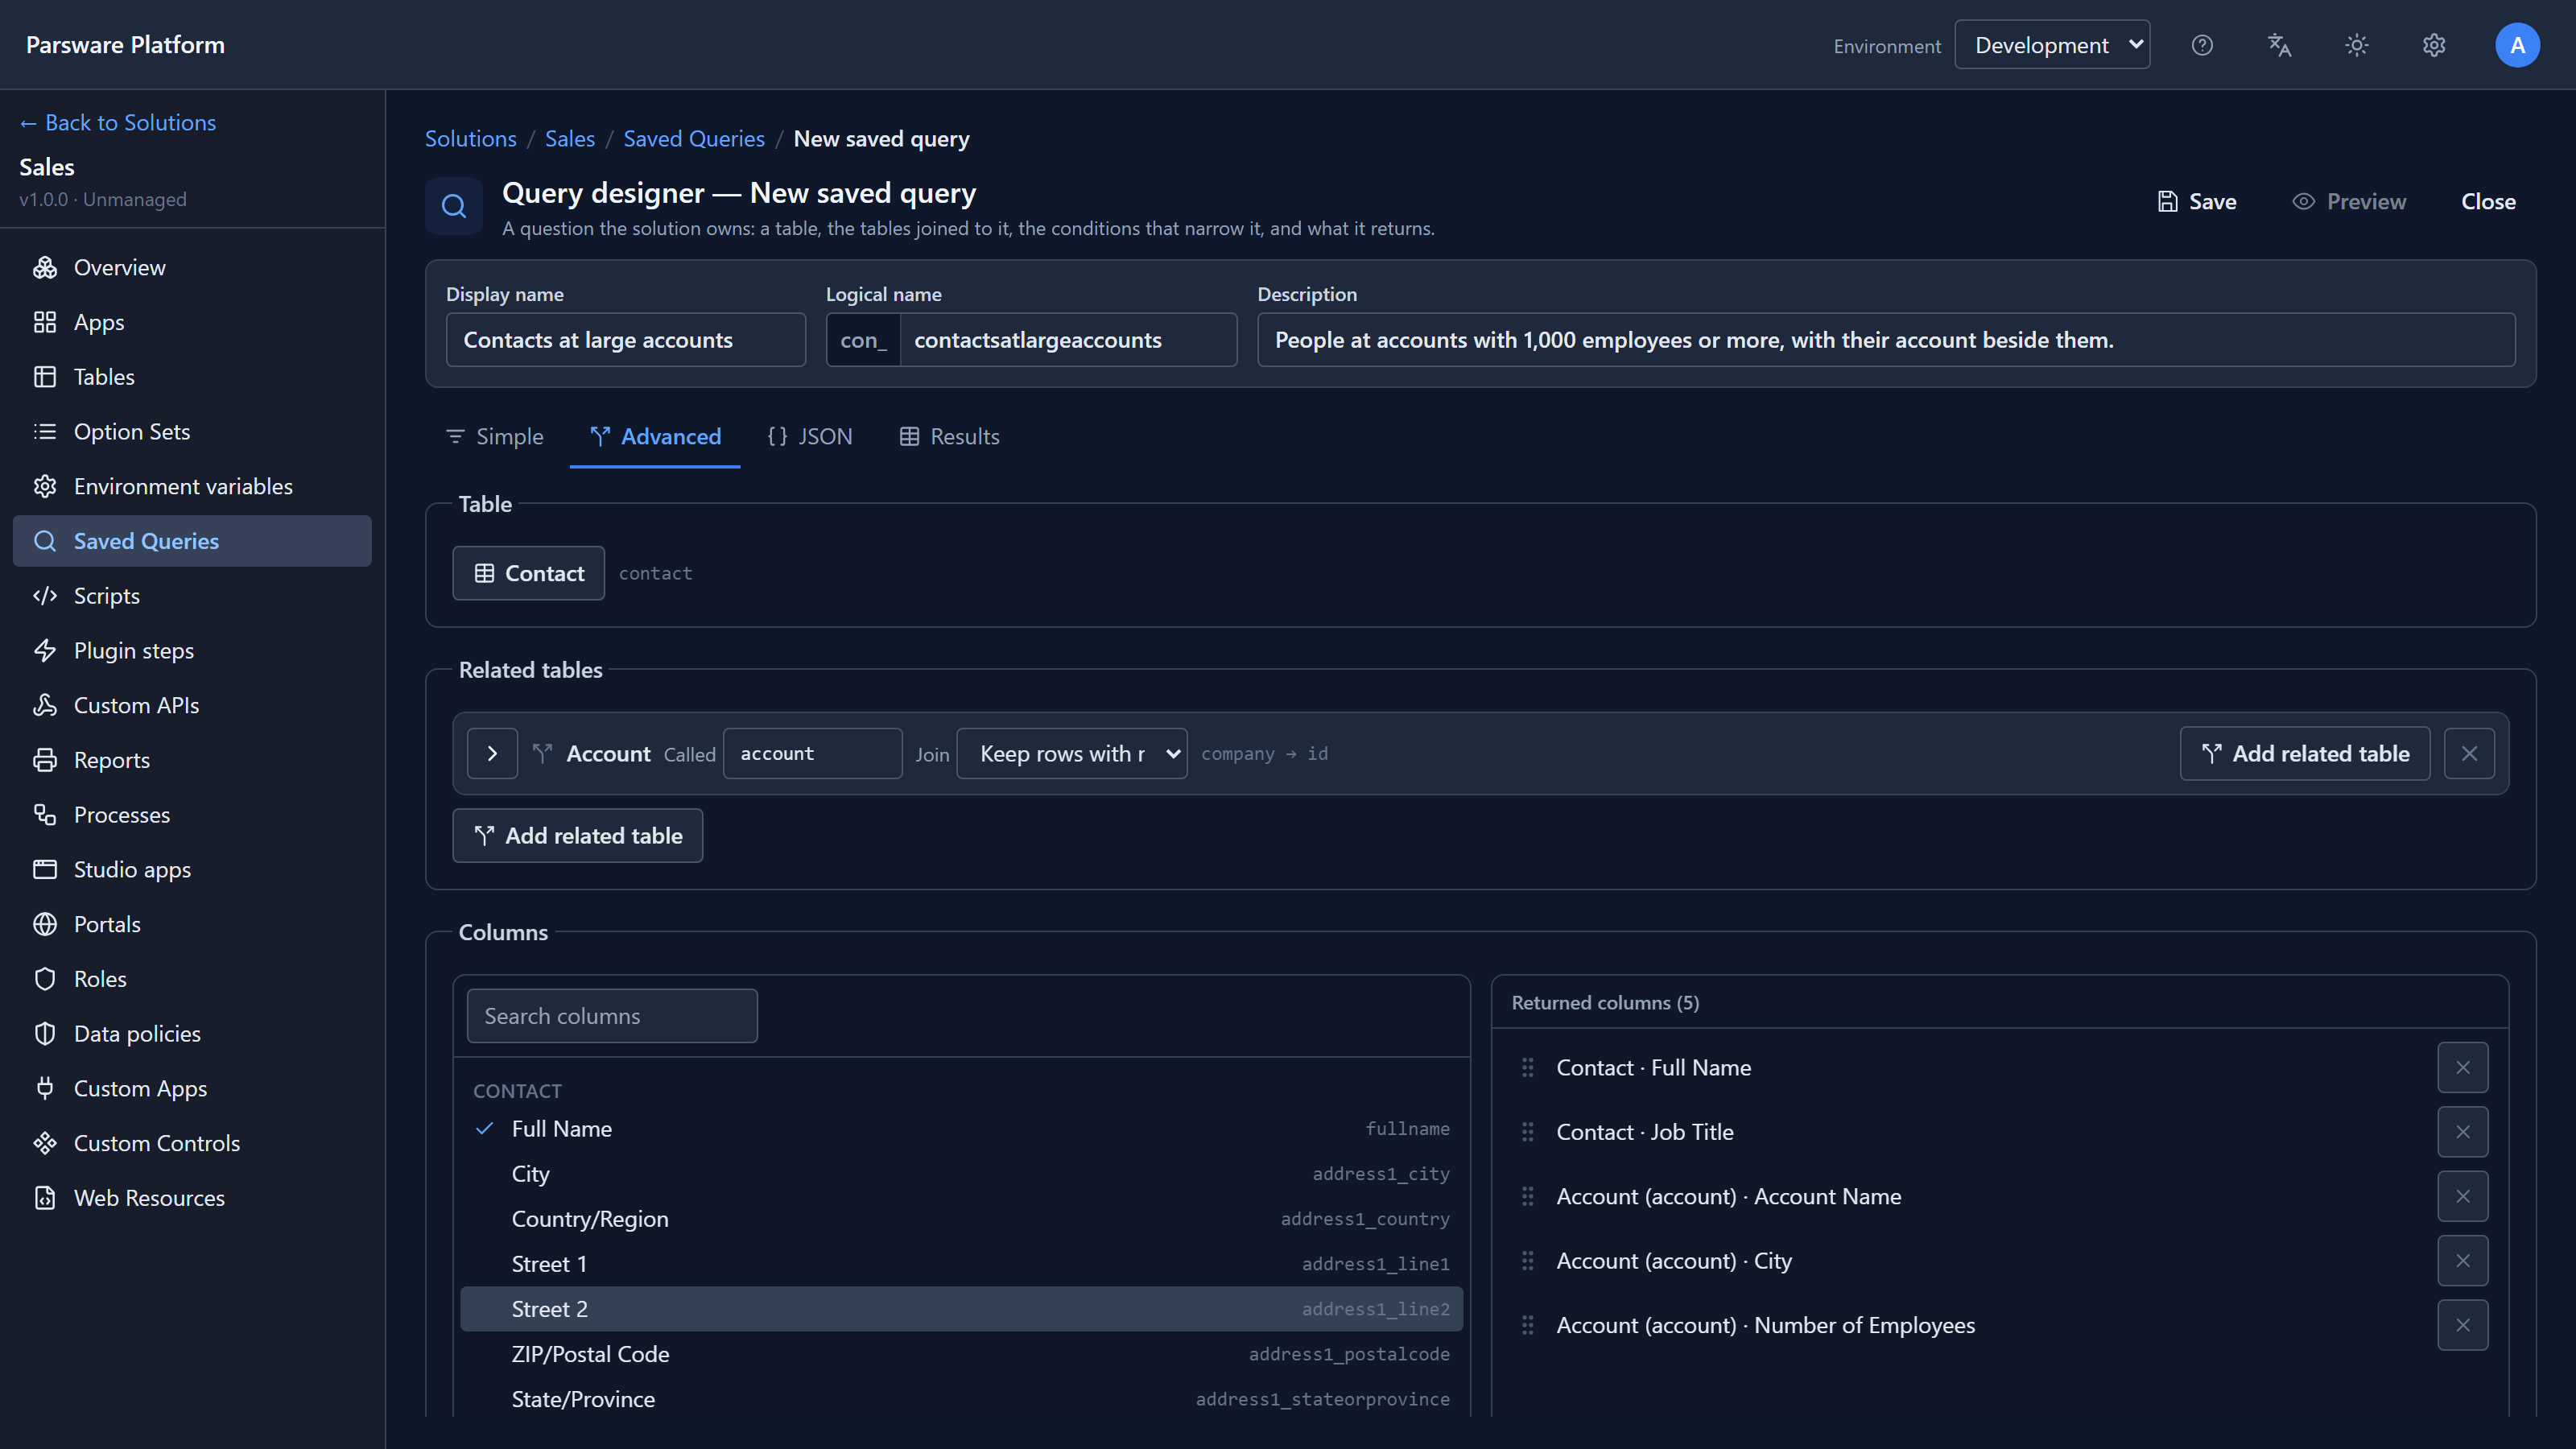
Order matters: it is the order the columns come back in, and the order a report prints them in. Drag a row by its handle to move it. Leave the right pane empty to return the table's own columns.
You don't need to know which table a column belongs to. Ticking the account's City files it under the join for you.
Narrow it
The Filter is the same And/Or builder a view uses (filters with And and Or), but it offers every column in the query, the joined table's as well. We asked for accounts with at least 1,000 employees, and sorted by the account's name:
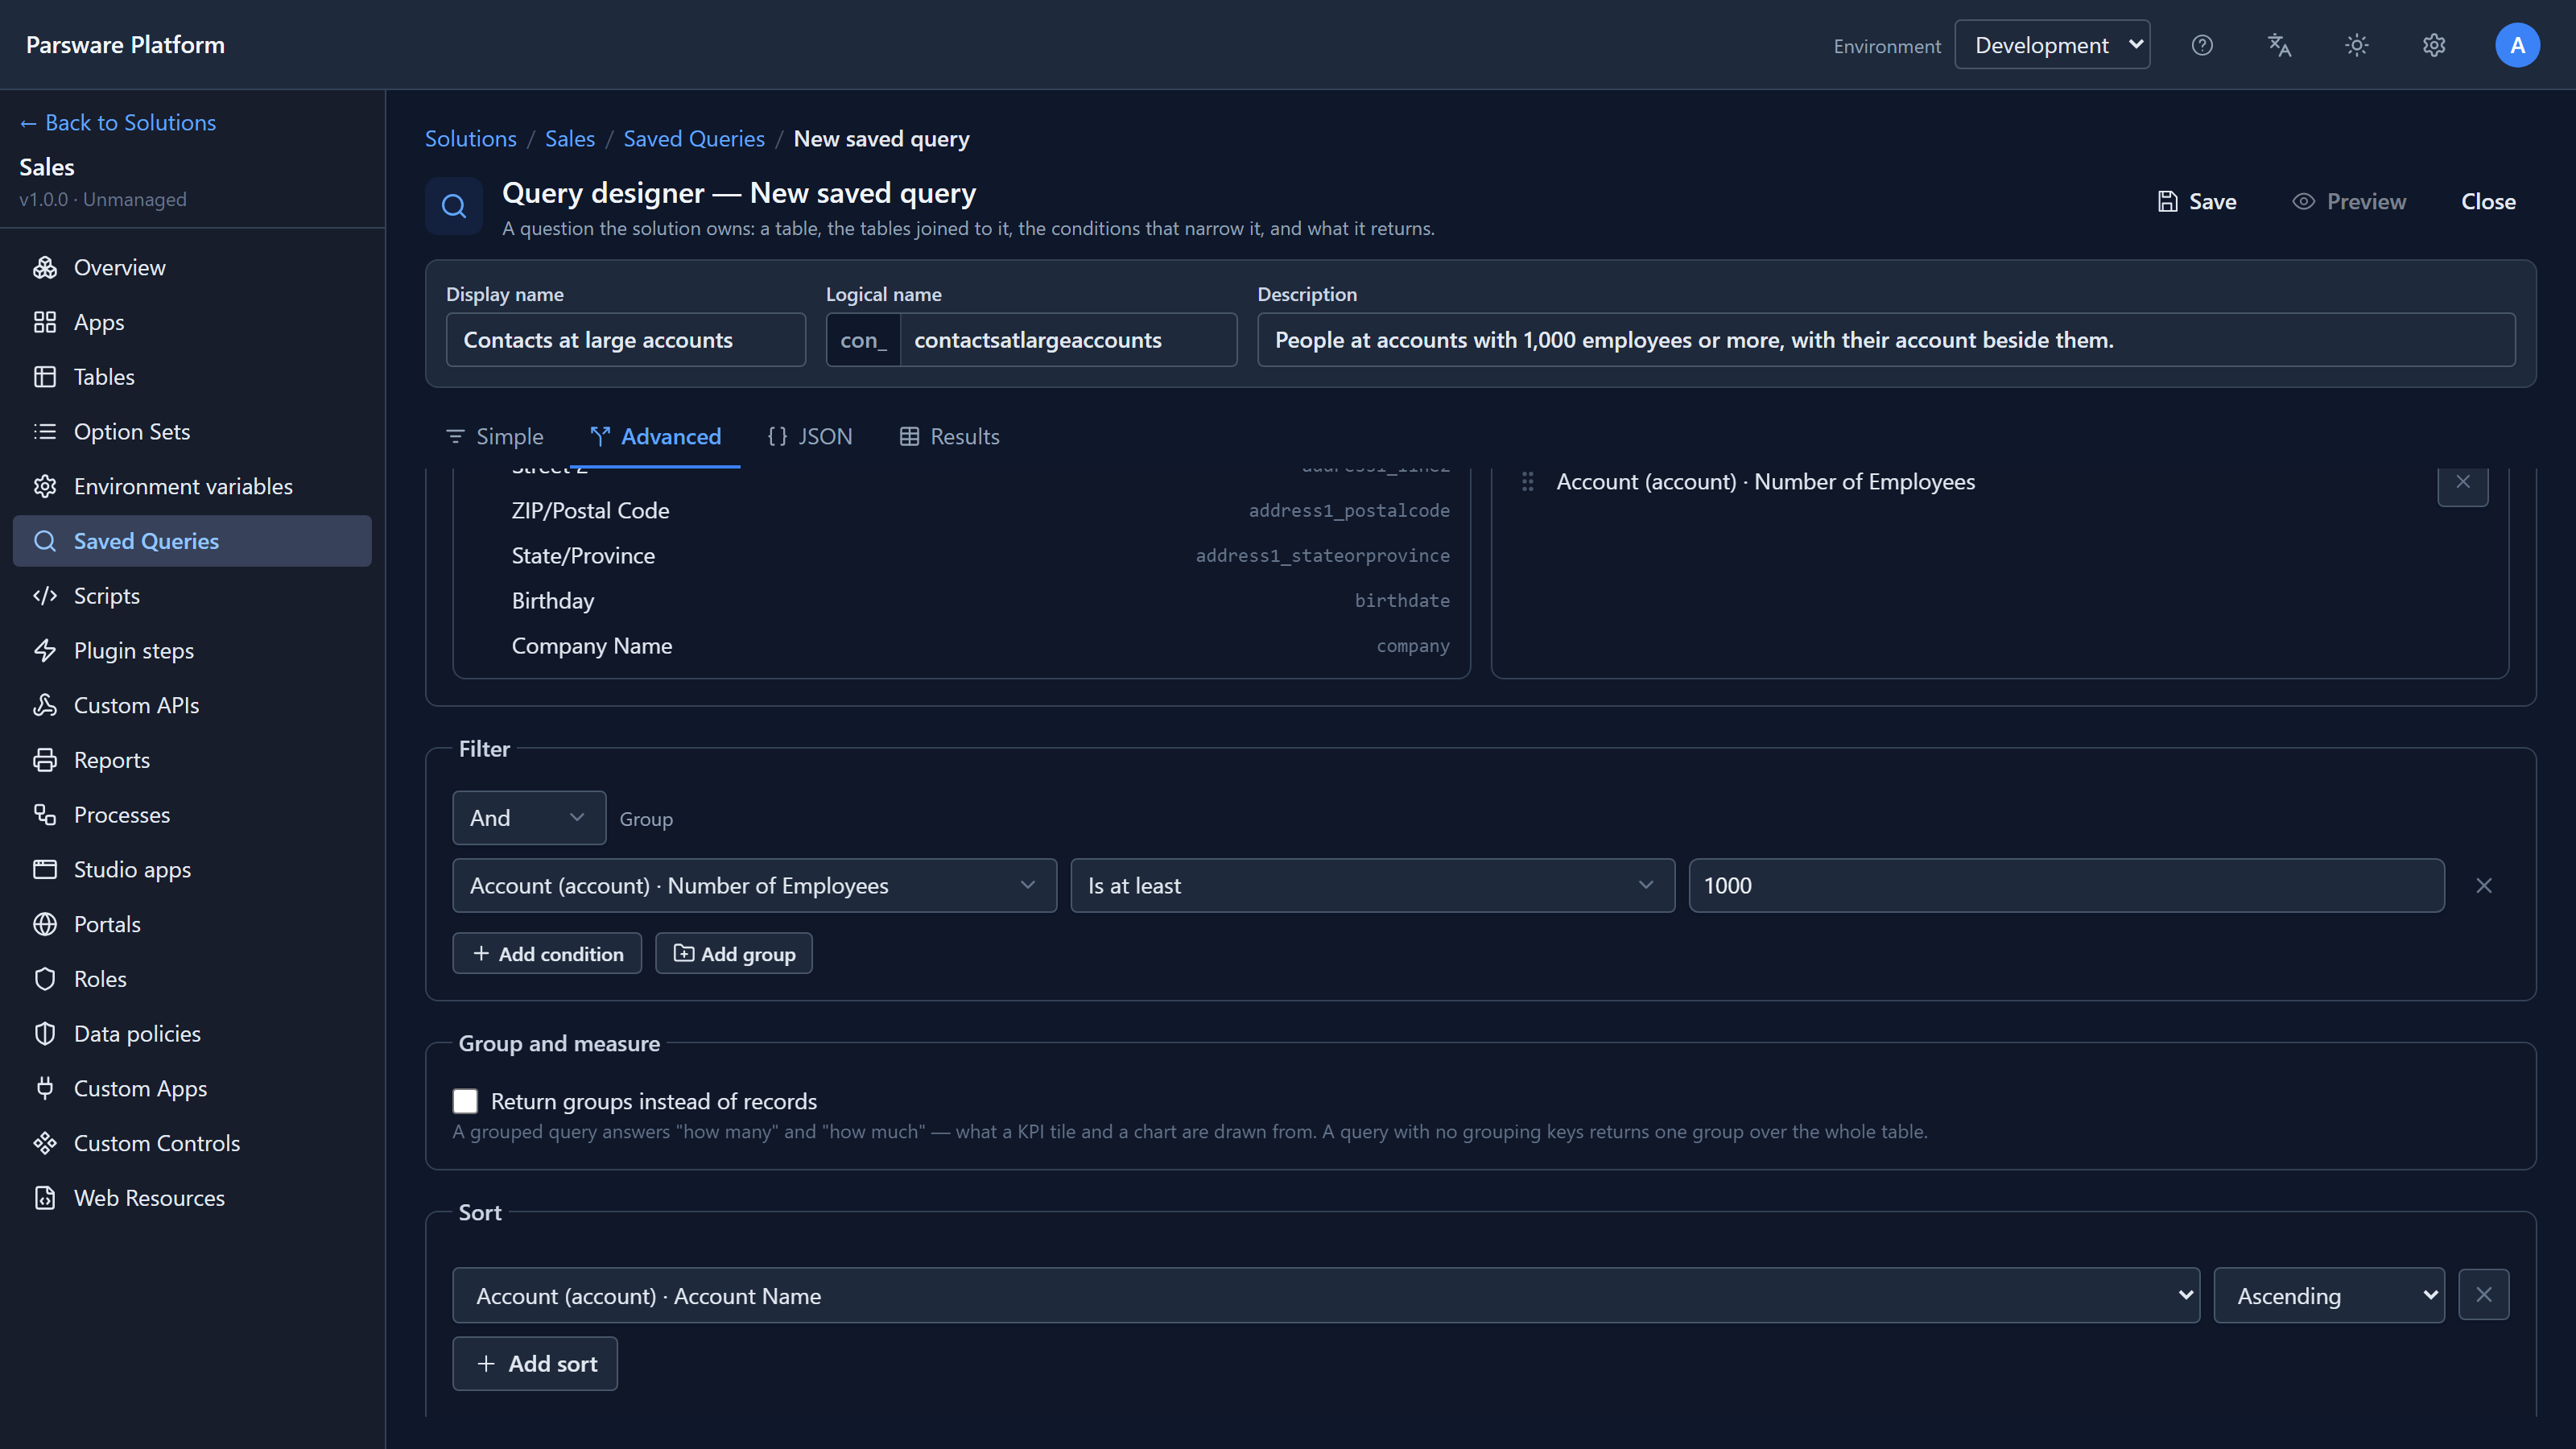
That condition is the whole point of the join. A contact doesn't know how big its account is; only the account does.
Is at least and Is at most are there because "at least 1,000" written as "greater than 999" is only right for whole numbers. On a decimal or a date it is quietly wrong.
Save, then look at the answer
Save checks the query three ways: that it is a well-formed document, that it is a valid query, and that it would run here, with every table, join and column found in this environment. A query naming a field that doesn't exist is refused now, instead of failing later for whoever opens the report.
Preview runs the saved query and opens Results:
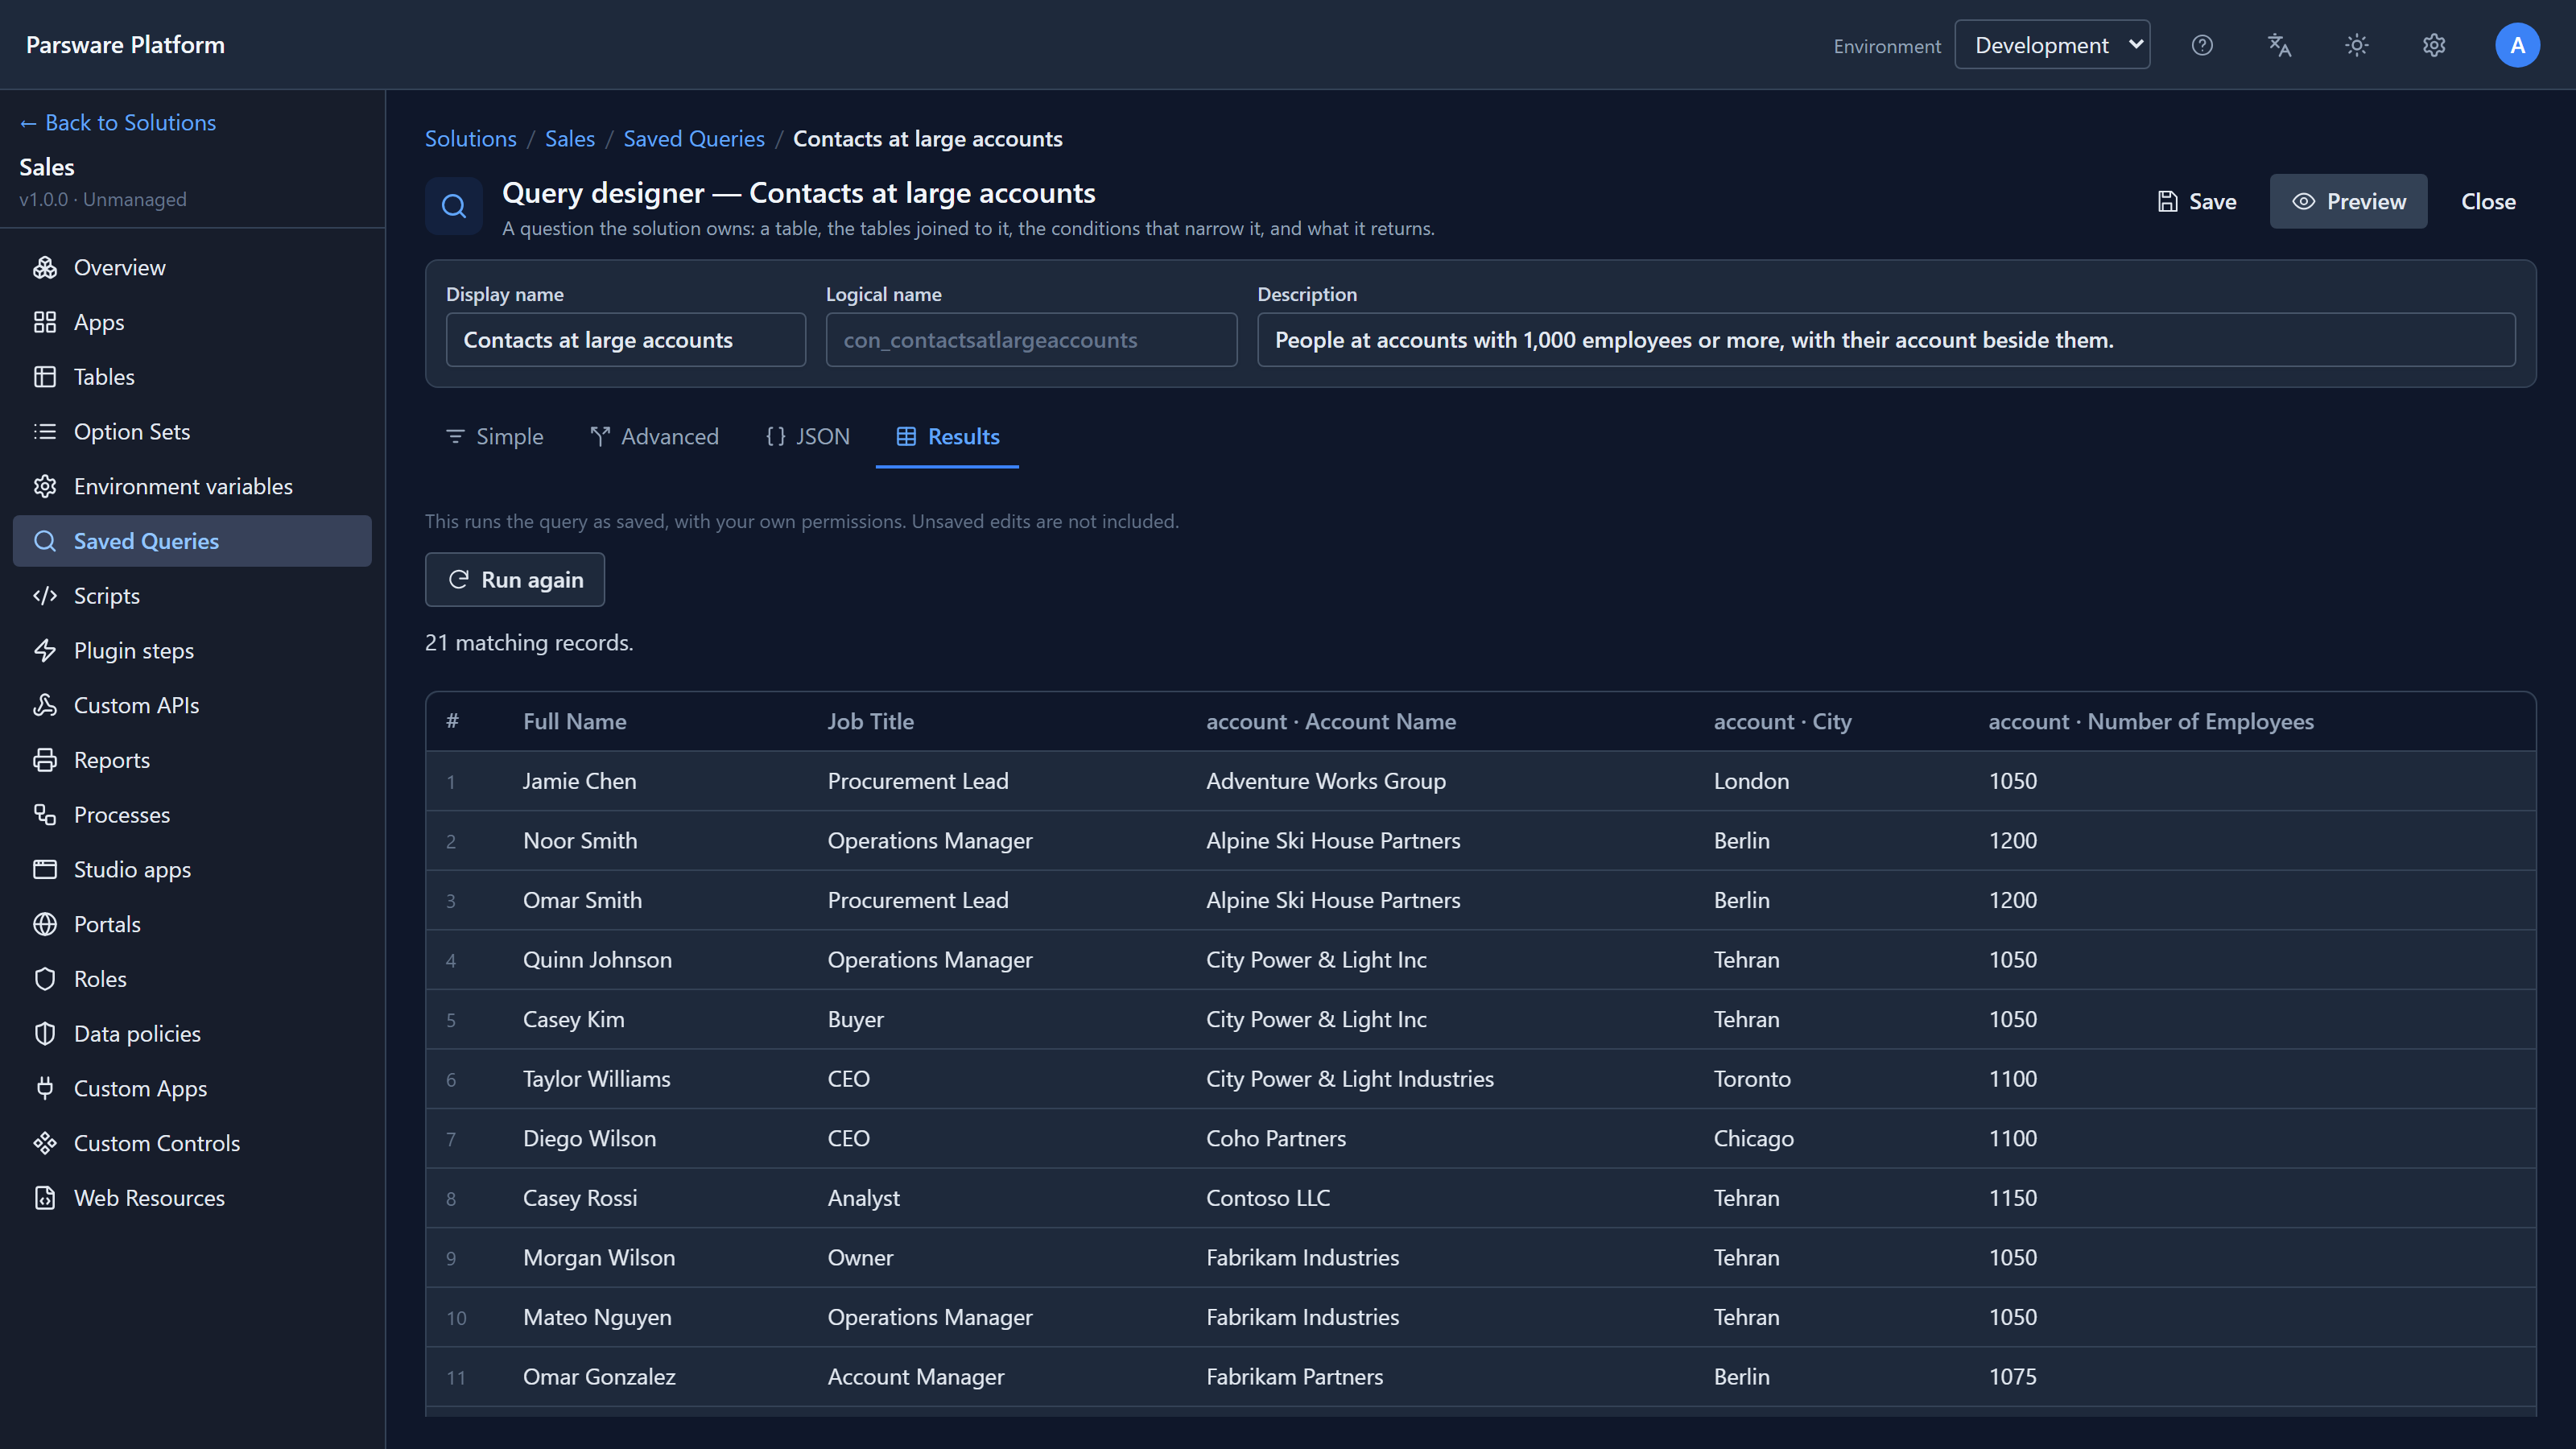
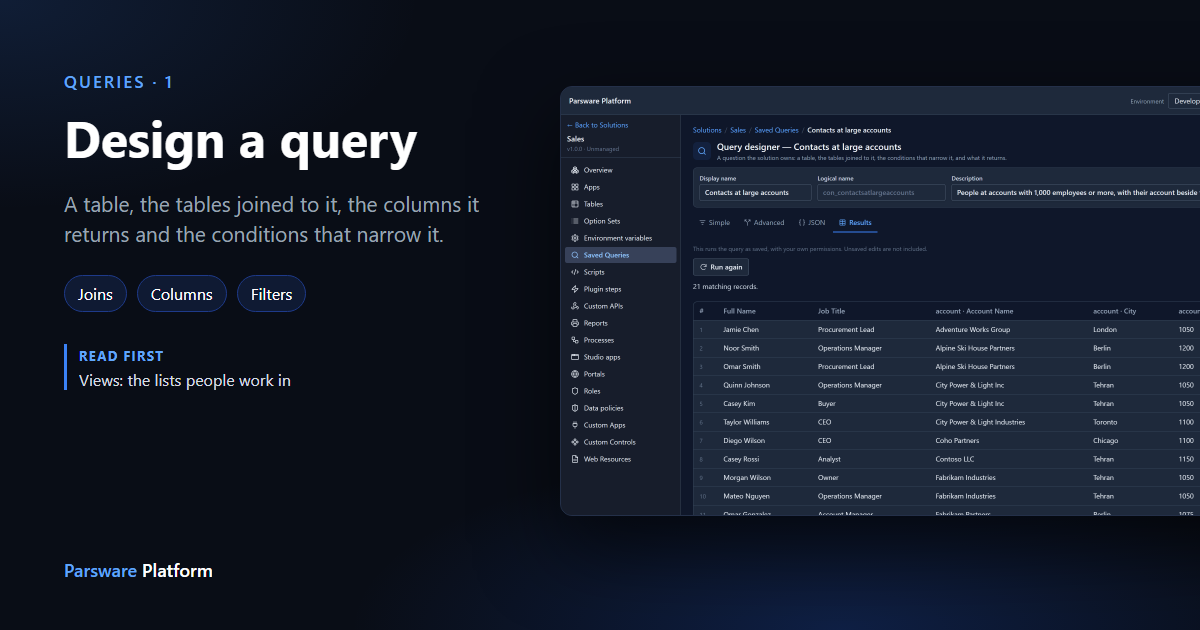
21 contacts, each with their account beside them, sorted by account. It runs with your own permissions and shows the query as saved, so save again after a change before you preview.
The query is a document
JSON shows what you built: the table, the columns, the join with its from and to, the filter.
This is what a report or a script refers to, and what travels in the solution to Test and
Production:
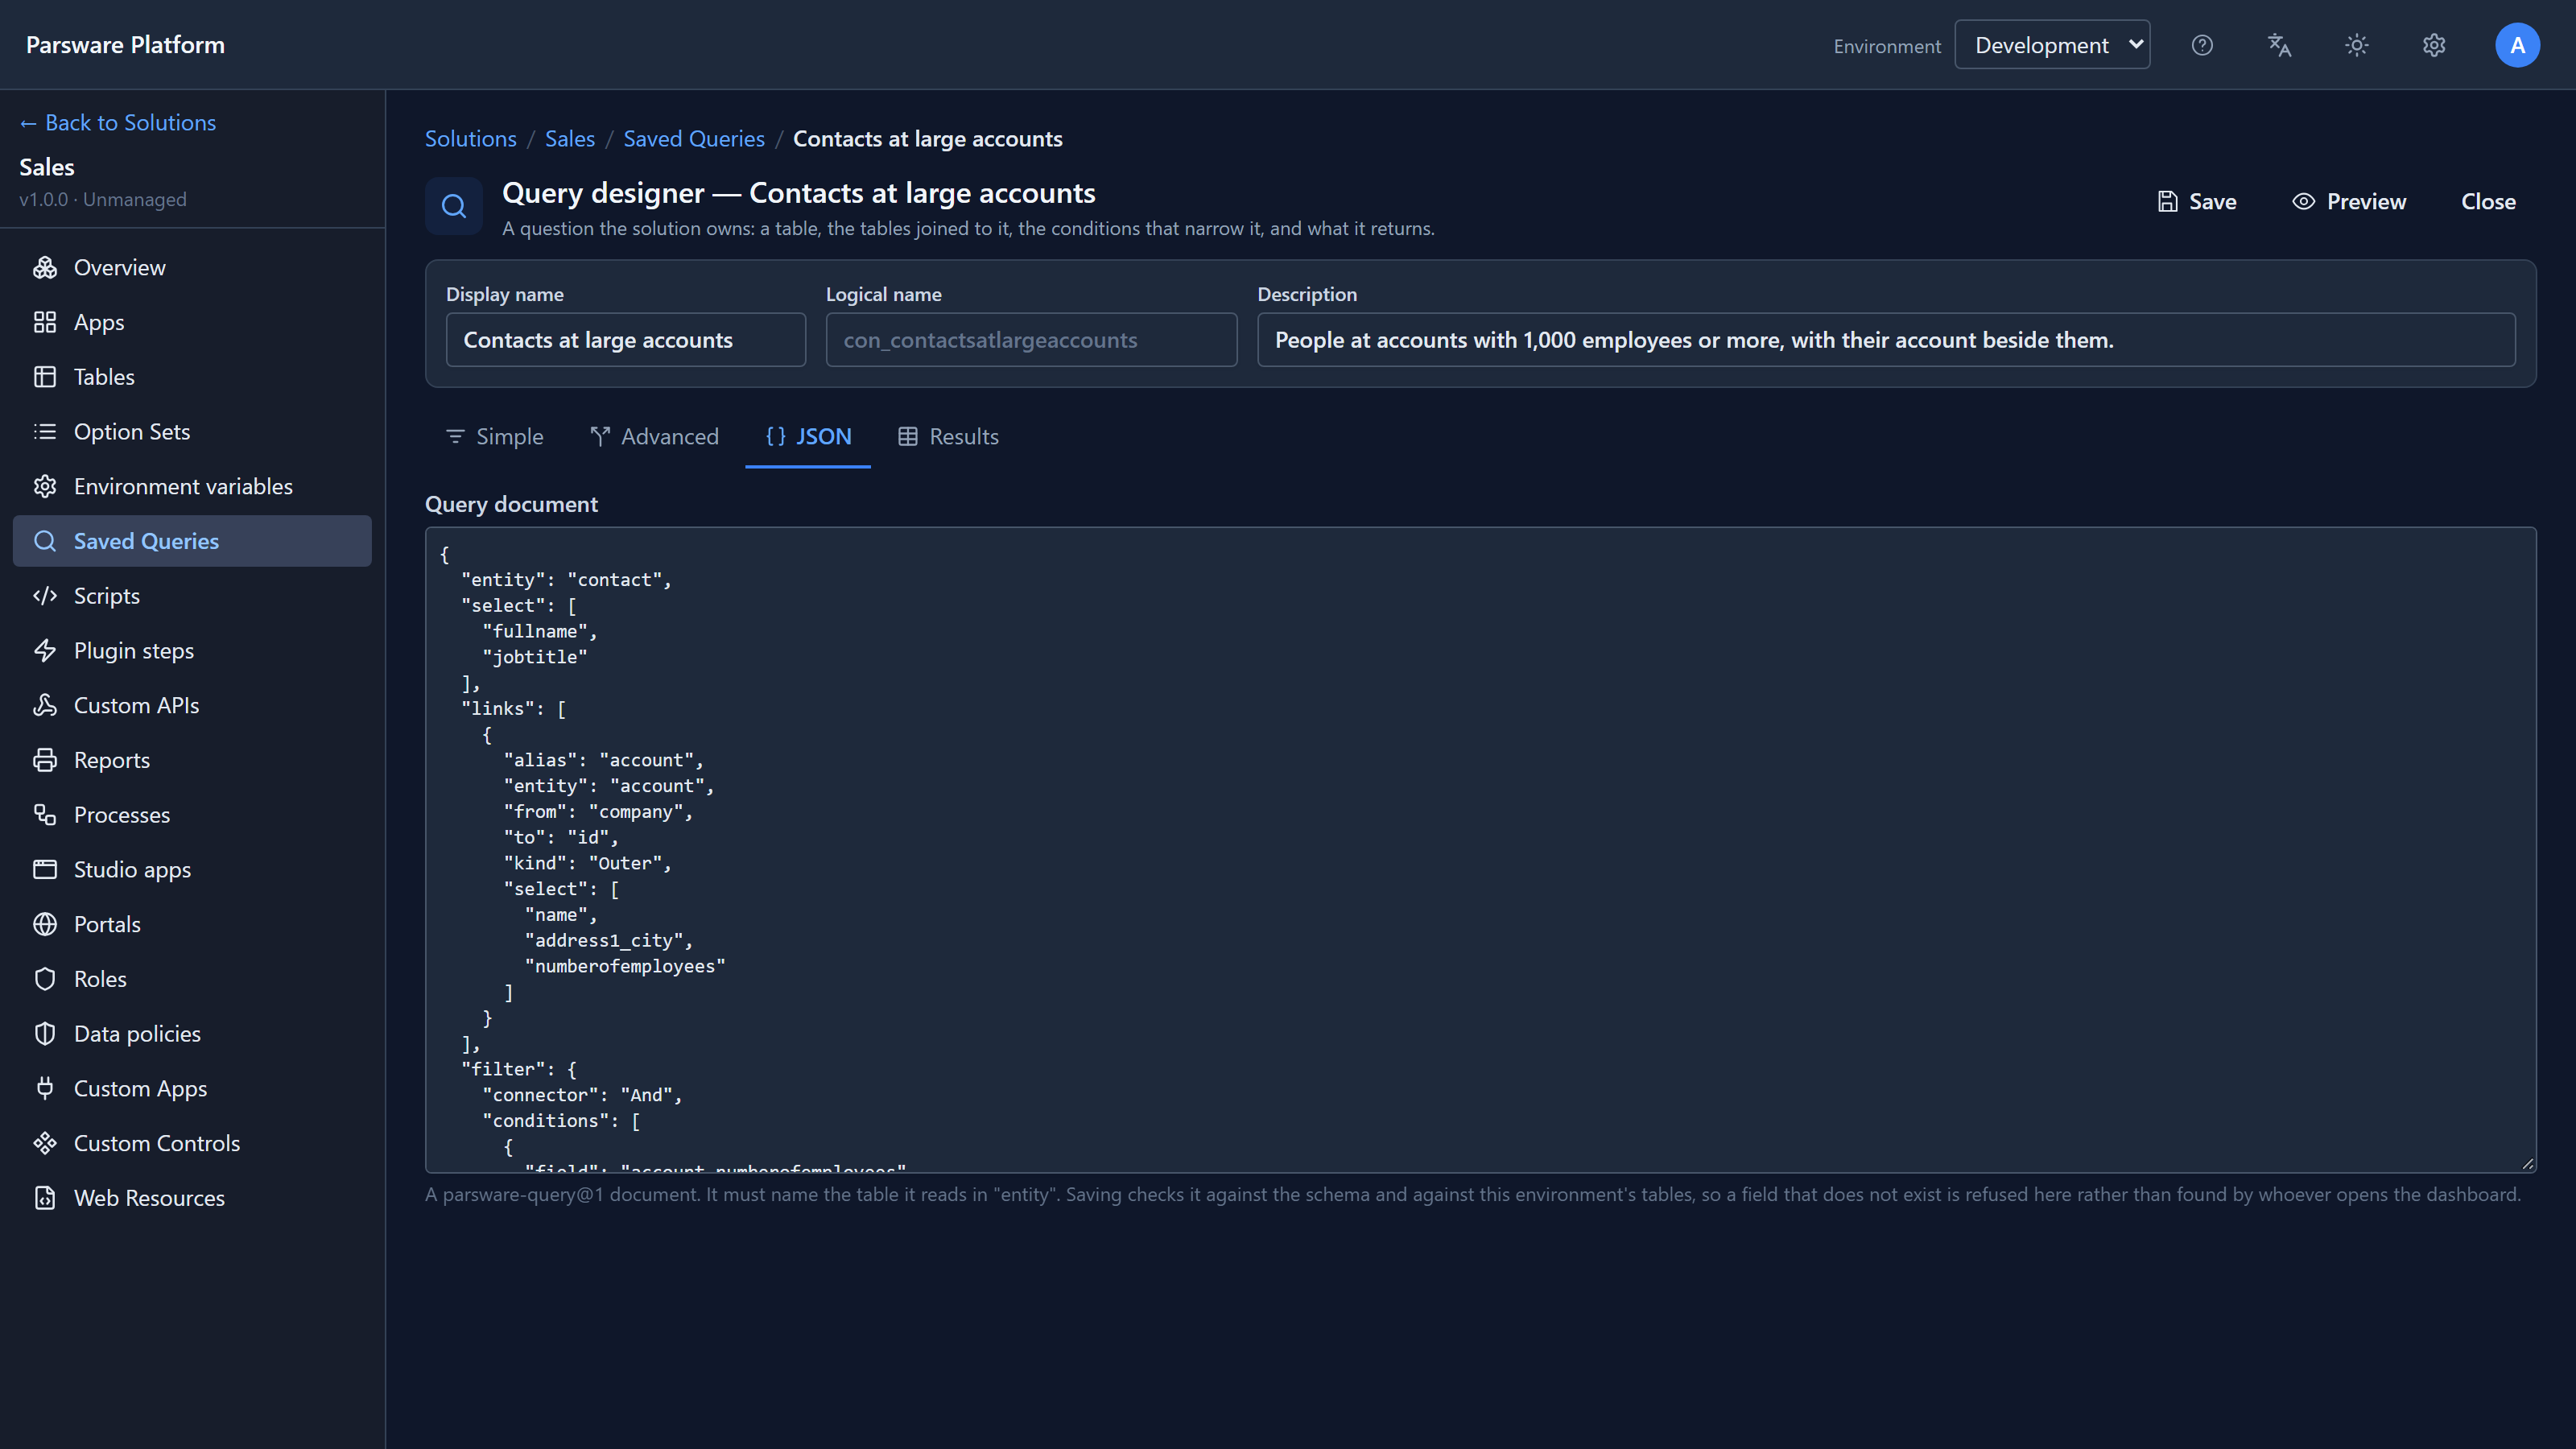
You can edit it here too, for anything the form doesn't draw. It's checked the same way when you save.
Grouping, for another day
Tick Return groups instead of records and a query answers "how many" and "how much" instead of "which": counts and sums by group, which is what a chart or a counted tile is drawn from. That is a subject of its own.
Next: saving a query once and using it in a report and a script.