Parsware Platform
How is a process doing?
A run's page says where one request has got to. A process's Insights screen says what keeps happening: how many runs got through, how long work waits before anybody picks it up, where runs stall, and how decisions usually go. Trying it, we fixed two things: decisions are named by their button, and the people view names people.
Dieser Artikel ist nur auf Englisch verfügbar.
Where has this request got to? is a question about one run, and its page answers it. Approvals take forever is a different complaint. It's about every run, and opening them one at a time won't tell you why.
Each process has an Insights screen for that. It says how many runs got through, how long work
waits before somebody picks it up, which runs are stuck, and how decisions usually go. We used the
Two-Step Record Approval sample from samples/solutions/bpms-two-step-record-approval, the same
process as in A two-step approval, after ten change requests had
been through it. Robin Park reviews them and Sam Taylor approves them.
Where it is
In the maker portal, open the solution, then Processes, the process, and Insights on the rail, under Runs:
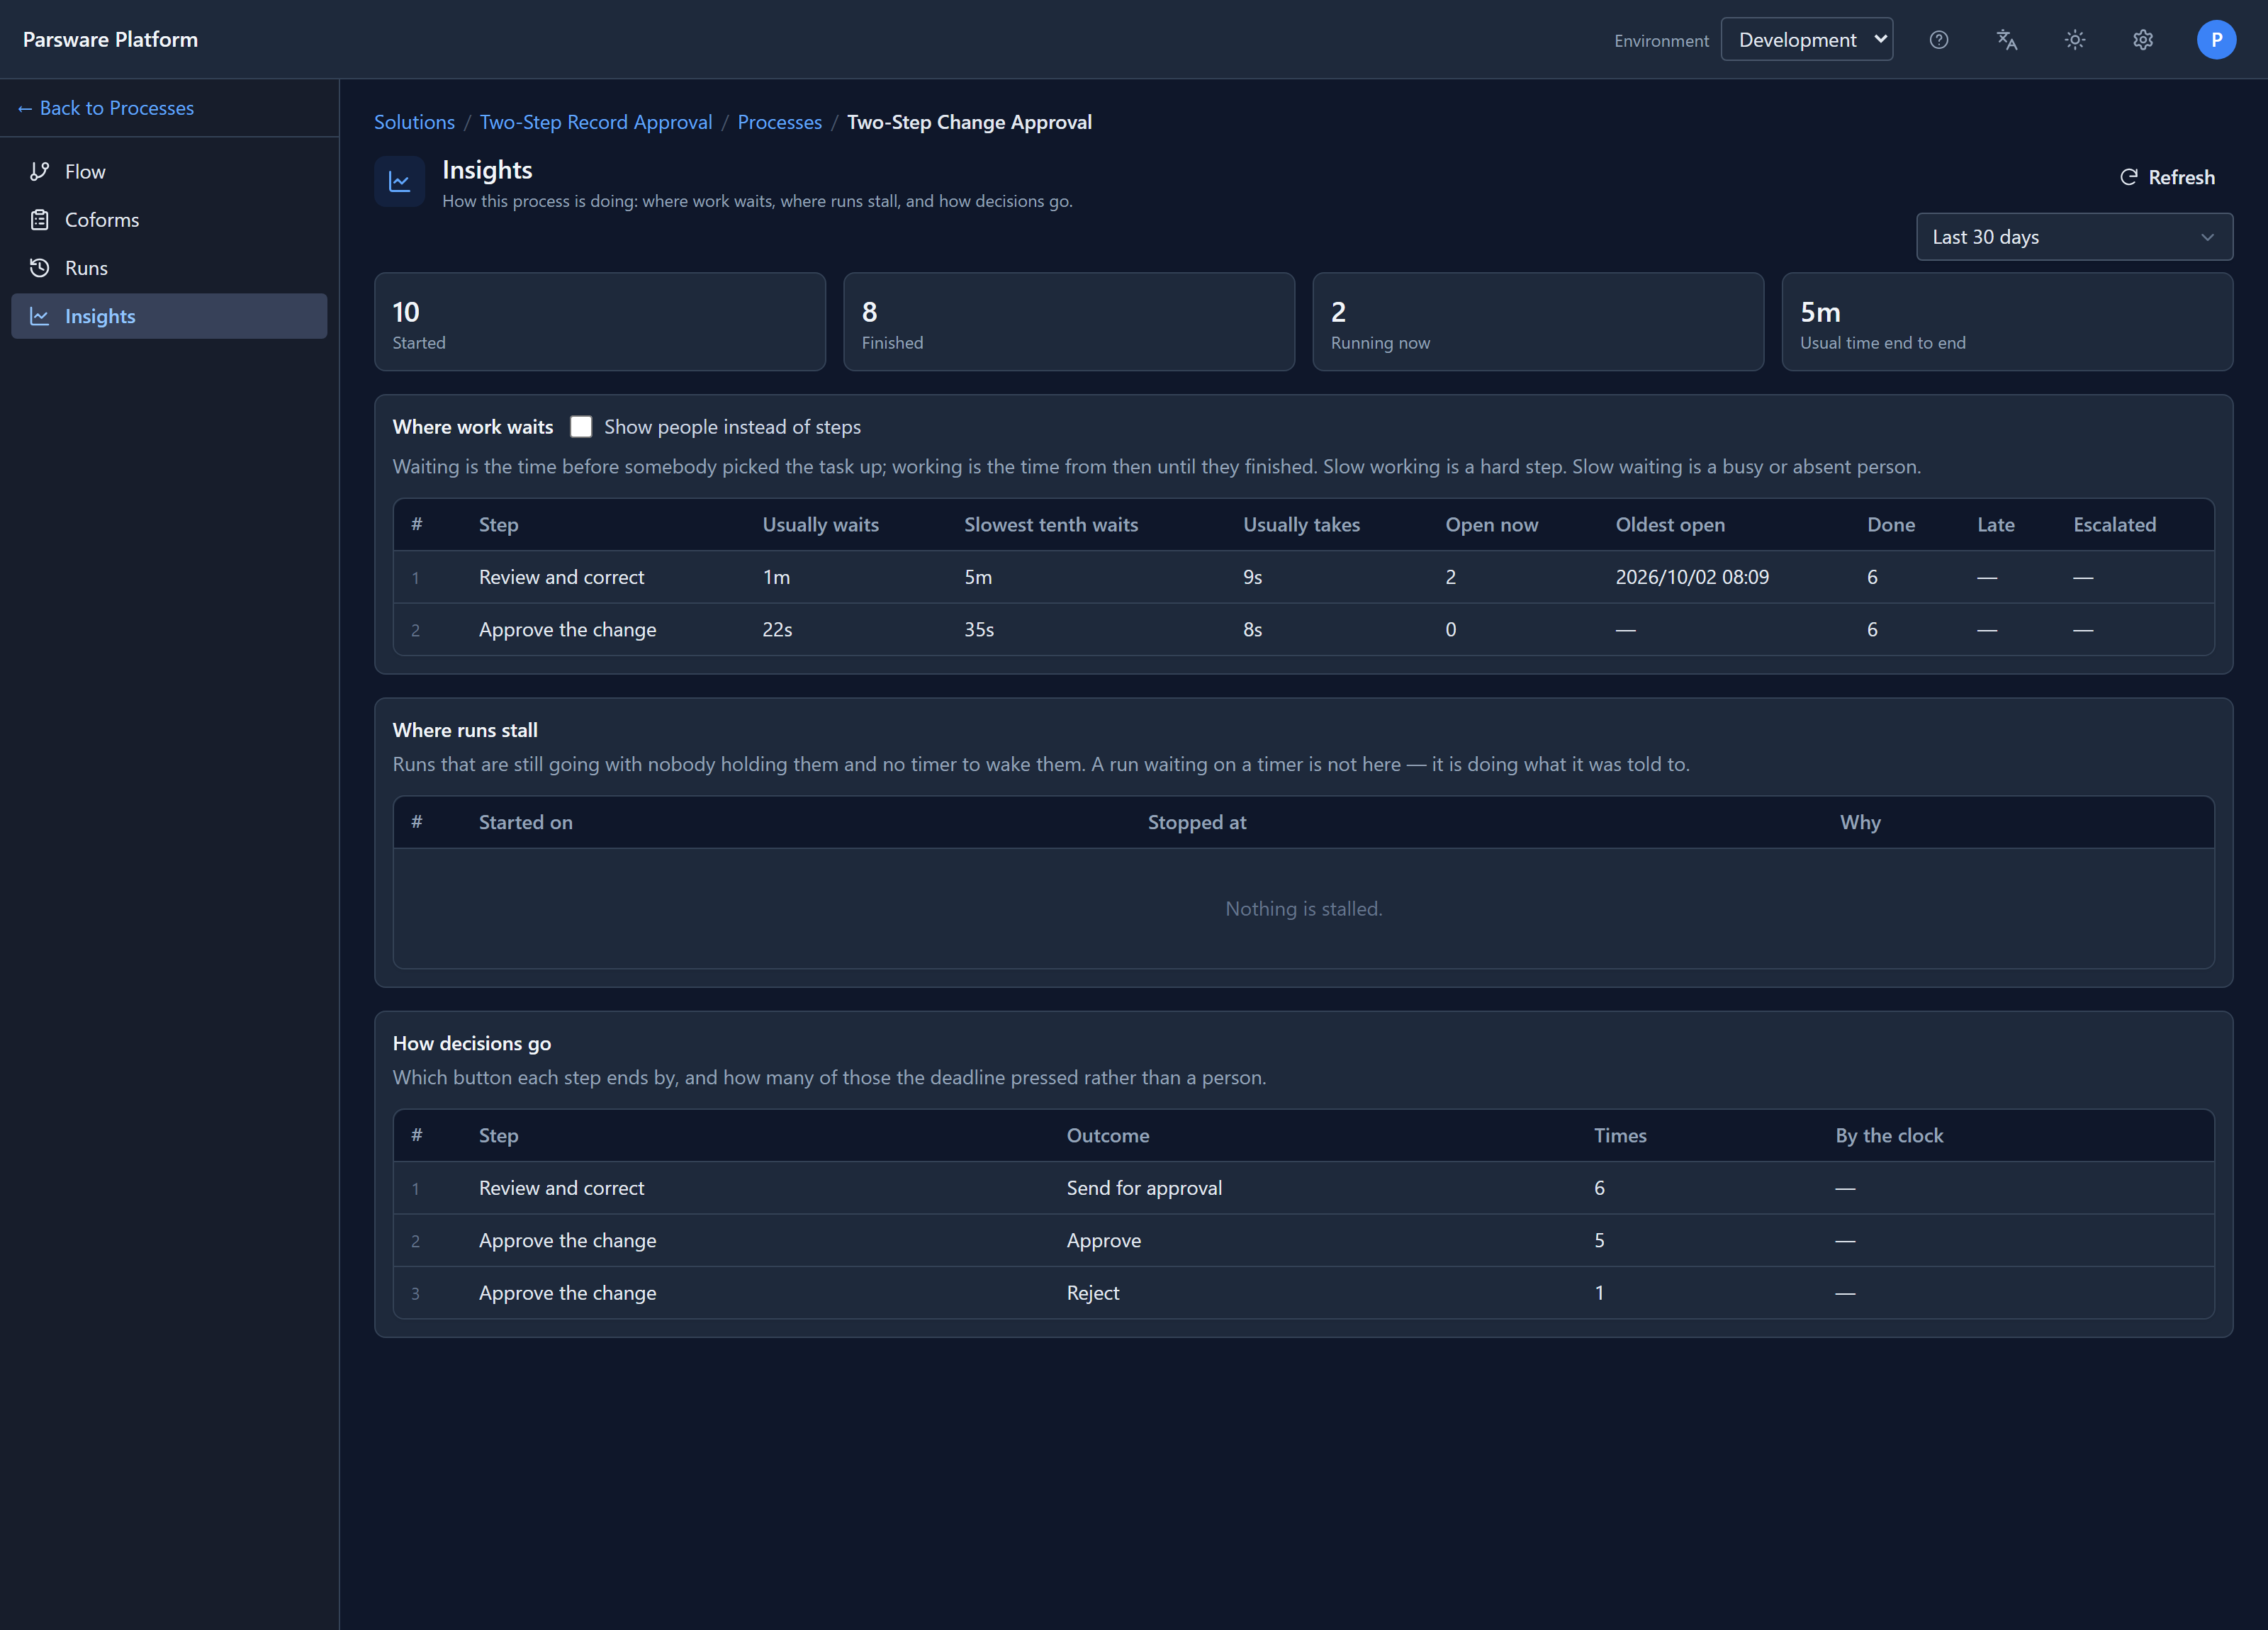
Everything on the screen is about a period, picked at the top right: the last 7, 30 or 90 days.
The four numbers at the top
How many runs started in the period, how many finished, how many are running now, and how long a run usually takes end to end.
Started and finished don't have to match. A run that started last month and finished this week counts as finished only. That's the honest answer to how much did we get through.
Where work waits
The most useful part of the screen. One row per step:

It keeps apart two numbers most reports add together:
- Usually waits is the time from a task appearing in somebody's list to somebody picking it up.
- Usually takes is the time from picking it up to finishing it.
They need opposite fixes. A step that's picked up at once and then takes four hours is a hard step: a long form, a report to read, a decision that needs thought. Simplify it or split it. A step that sits for two days and is then done in ten minutes is a busy or absent person. Widen who it goes to, add a deadline, or find out who's away. One how long did it take number would call both of them slow and point at neither fix.
Slowest tenth waits is how bad the tail is: the wait that one task in ten is slower than. These are medians, not averages. One approval left over a holiday weekend moves an average far enough to make a healthy step look broken.
Beside them: how many are open now, since when the oldest open one has waited, how many are done, how many ran late, and how many were escalated. Our two open tasks are the two requests we'd just sent; Robin hasn't looked at them yet.
Deadlines show here too
The Deadlines and Timers sample, from Deadlines and timers, has a support ticket that has to be answered within the hour:

Late counts the tasks still open when their deadline passed. Escalated counts the ones that were also offered to somebody further up because of it.
People instead of steps
The screen opens grouped by step, and it names nobody. A step that waits three days is something you can fix, and finding that out shouldn't hand you a ranking of your colleagues.
When you need it, tick Show people instead of steps: somebody is away, a queue is stuck on one person, work is unevenly spread. The same columns, asked of people:

A row is whoever the task was offered to. This sample offers each step to a role, so most rows are roles. Robin Park has a row of their own because in Watch a process run we handed one task on to them by name. A task offered to four people appears under all four, because it was in four lists.
That's new. Ticking the box used to show every row with a step's name, and the people it was
meant to name were references like role:par_change_reviewer. Each row now says who it is, with the
names the run page and the task list use.
Where runs stall
Runs that are still going with nobody holding them and no timer to wake them: a step that found nobody to go to, or a branch where no condition was true. Each row says the step it stopped at and why, and its date opens the run.

Ours is empty, which is what you want. A run waiting on a timer isn't listed. A process told to wait a day looks exactly like a stuck one from the outside, and a list that called it broken every night would soon be ignored.
How decisions go
Which button each step ends by, and how often:

This is what answers how often does this get turned down. One in six, here.
By the clock says how many of those the step's deadline decided rather than a person. In the Deadlines and Timers sample, Still needed? closes the ticket by itself when nobody answers:

Rejected because somebody decided to and rejected because nobody looked at it in three days are the same outcome and completely different facts. A step with a high number here needs a longer deadline or more people, not a different decision.
That's new too. This table used to show the outcome's internal name, sent_for_approval. It now
shows the words on the button the person pressed, as the run page does.
Where the numbers come from
Nothing is scheduled and nothing is copied. Every number is worked out, when you open the screen, from what the runs already recorded: when each task appeared, was picked up and was finished, and when each run started and ended. So the screen is never out of date, and a process that hasn't run yet has nothing to show. A step whose tasks haven't finished shows — for its times, rather than a zero that would read as instant.
Try it
Import the two-step sample, send a few change requests through it as two people, and leave one waiting. Open Insights, then tick Show people instead of steps. Send one more, reject it, and press Refresh.
Next: the process travels: export it in a solution, import it into another environment with its roles, and uninstall it again.