For Power Apps
Your first report on Dataverse
A Parsware report is a page you draw and bind to a Dataverse table. This walks through the whole loop once in Parsware Studio. Create the design, name the table it reads, point a repeating row at it and bind two columns, and you end with 200 real rows on eight printed pages.
هذا المقال متاح بالإنجليزية فقط.
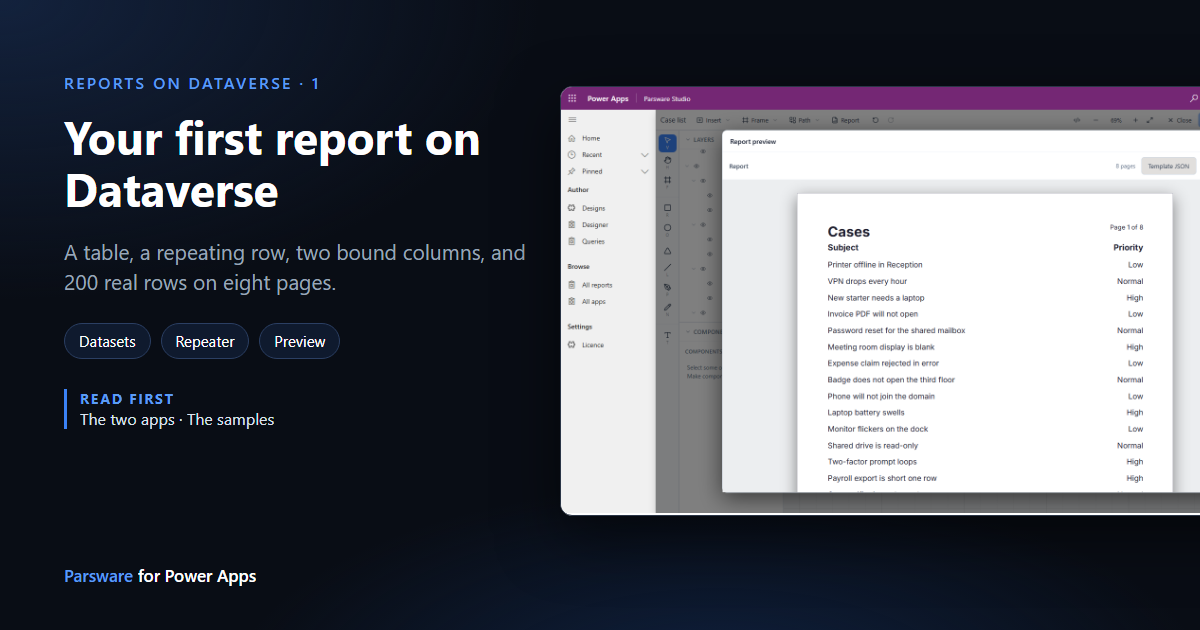
This is the shortest path from nothing to a report with real rows in it. We'll build a list of cases: a title, a heading row, and one line per case with its subject and priority, repeated down as many pages as it takes.
It uses the Case table from the samples, so fill it first if you're following along. Any table of your own works the same way.
Everything happens in Parsware Studio, in your development environment.
1. Create the design
A report starts as a row in the Designs list.
- In Parsware Studio, open Designs and press New.
- Give it a Name. That name is how apps will find the report later, so pick one you'll keep. We're using Case list.
- Set Kind to Report.
- Press Save.
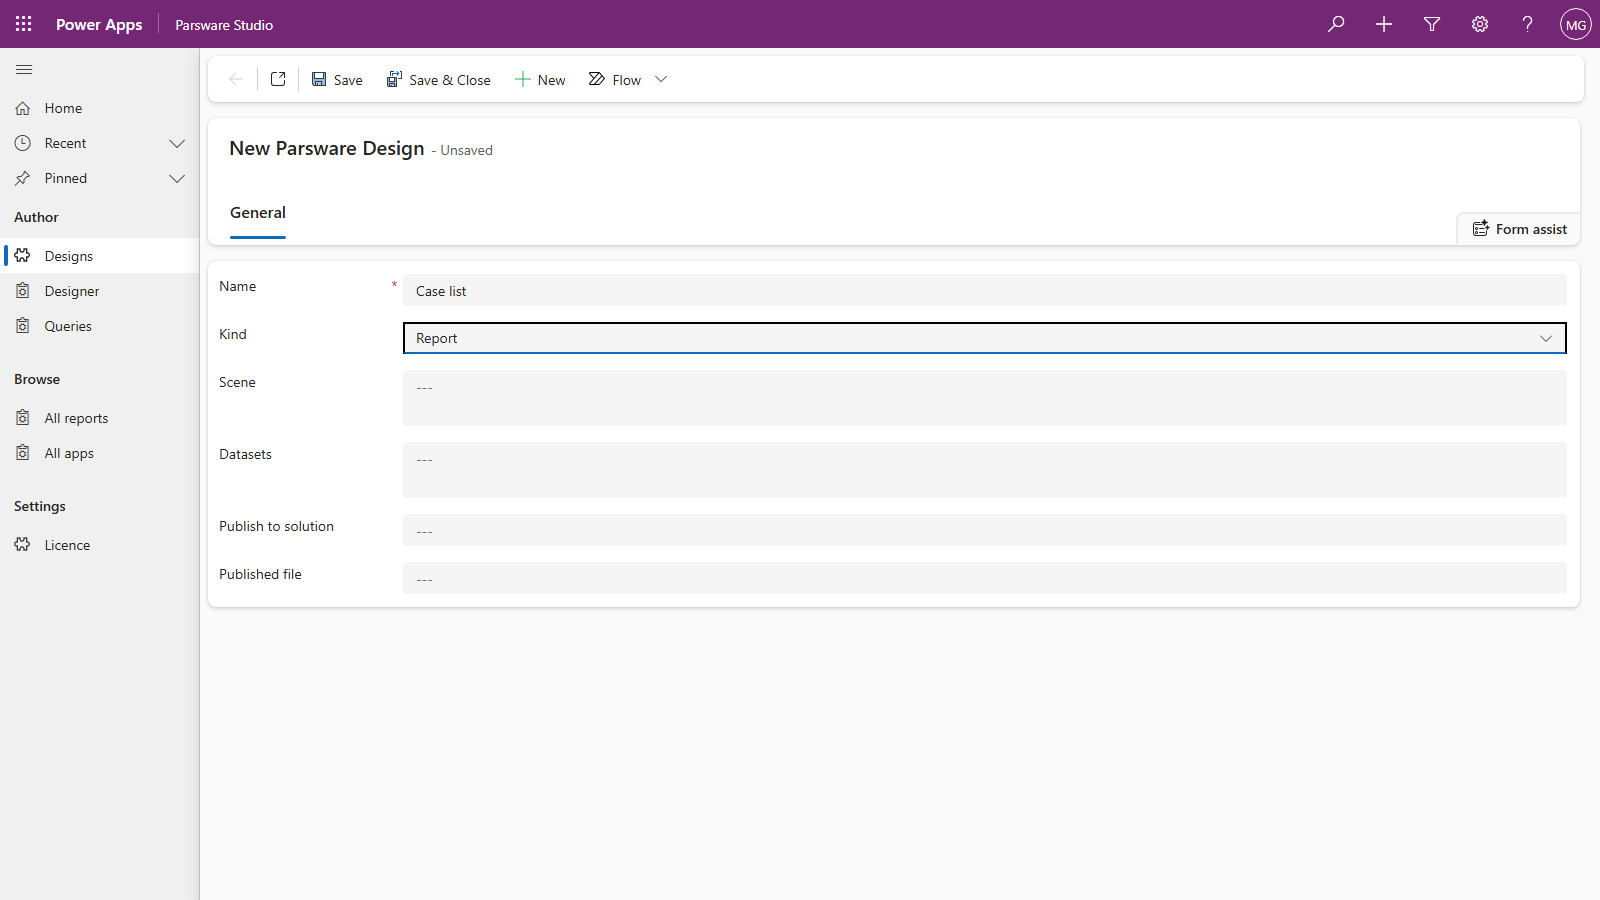
Leave the other fields alone. The designer fills in the drawing and the datasets, and the last two are filled when you publish.
2. Add a report page
Open Designer, search for Case list and press Open. A new design starts with a Styles frame, which holds the colours and text styles for the design, and nothing else.
Open Insert and choose Report page. That adds a frame tagged as the report's page, already laid out with the parts almost every report needs:
| Part | Printed |
|---|---|
| Page header | At the top of every page: a title, and Page 1 of 1, which becomes the real page count |
| Body title | Once, above the rows: the column headings |
| Row (repeater) | Once for every row of data |
| Page footer | At the bottom of every page |
The new page lands on top of the Styles frame, so move it clear first: select Report in the layers list and change its X in the Properties panel.
3. Say where the rows come from
A report reads rows from a dataset: a name, and the table it comes from. Press Datasets in the toolbar.
- Type a Name. The repeater will refer to it, so keep it short. We're using
cases. - Leave Source on Table view.
- Under Table, start typing and choose Case. The list is your environment's own tables, with each one's logical name under it.
- Leave View on Every row, and press Save.
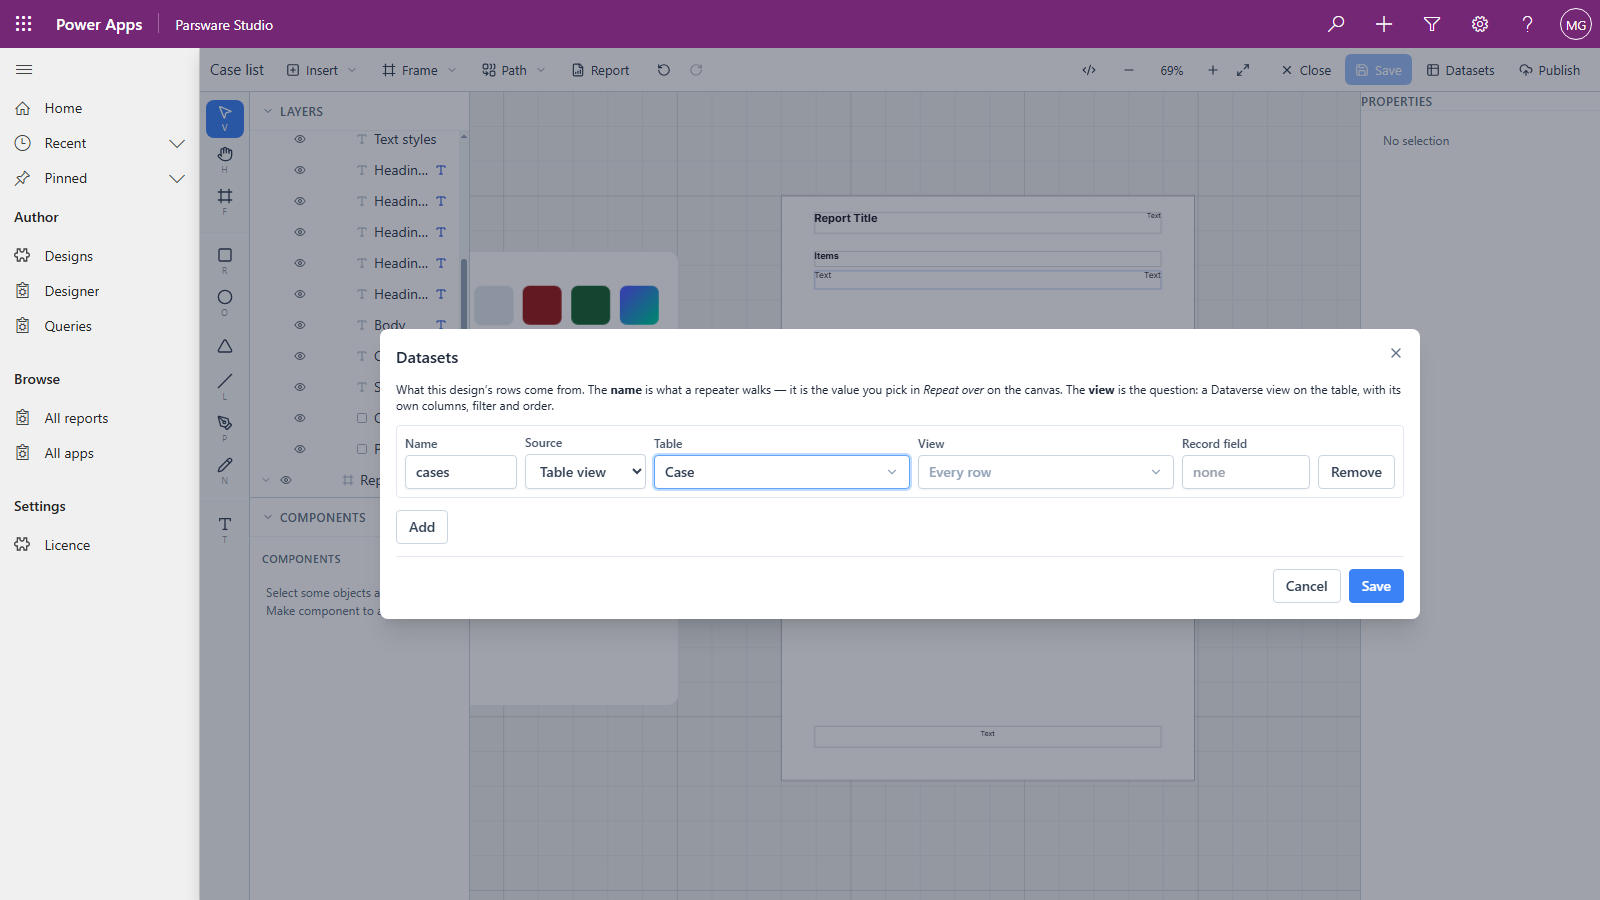
Every row means exactly that, up to 500. A report can read a Dataverse view instead, with its own filter and order, which is the next article.
4. Repeat the row over the cases
Select Row (repeater) in the layers list and open the Report tab of the Properties panel.
Set Repeat over to cases.
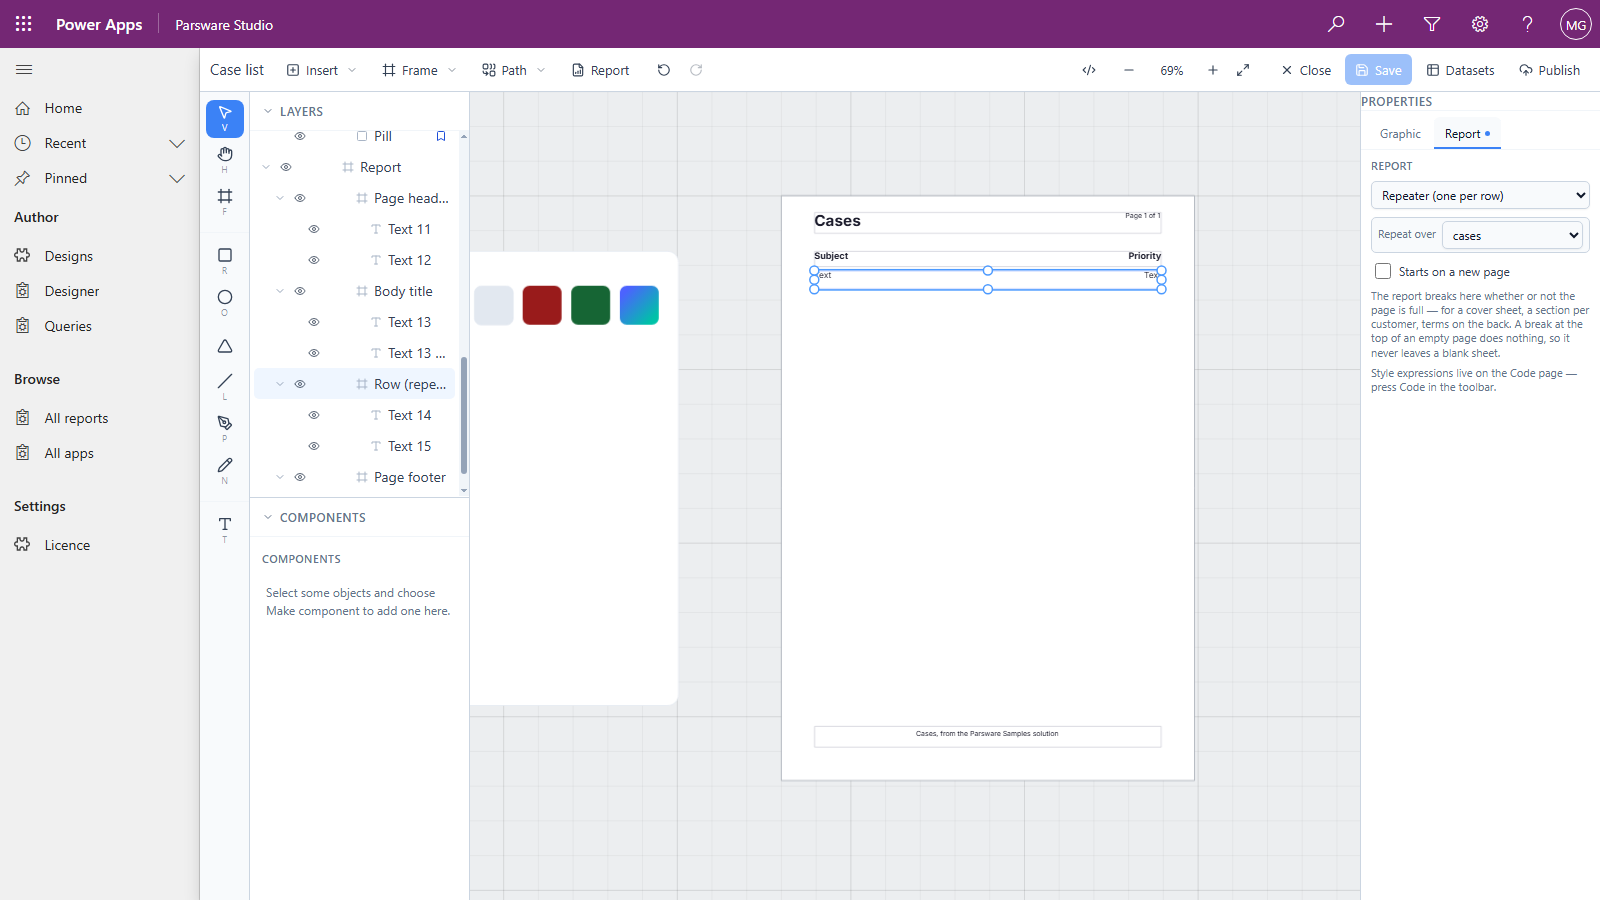
The template's row was bound to a placeholder dataset, so the designer asks before switching: changing the dataset clears the bindings inside the row, because each one named a column of the old dataset. Press Change and clear bindings. There's nothing in them to lose yet.
5. Bind the columns
The row has two text boxes. Select the left one, open the Report tab, and choose Subject under Binding. The list is the Case table's columns, by display name, read from your environment, so you pick a column rather than typing its name.
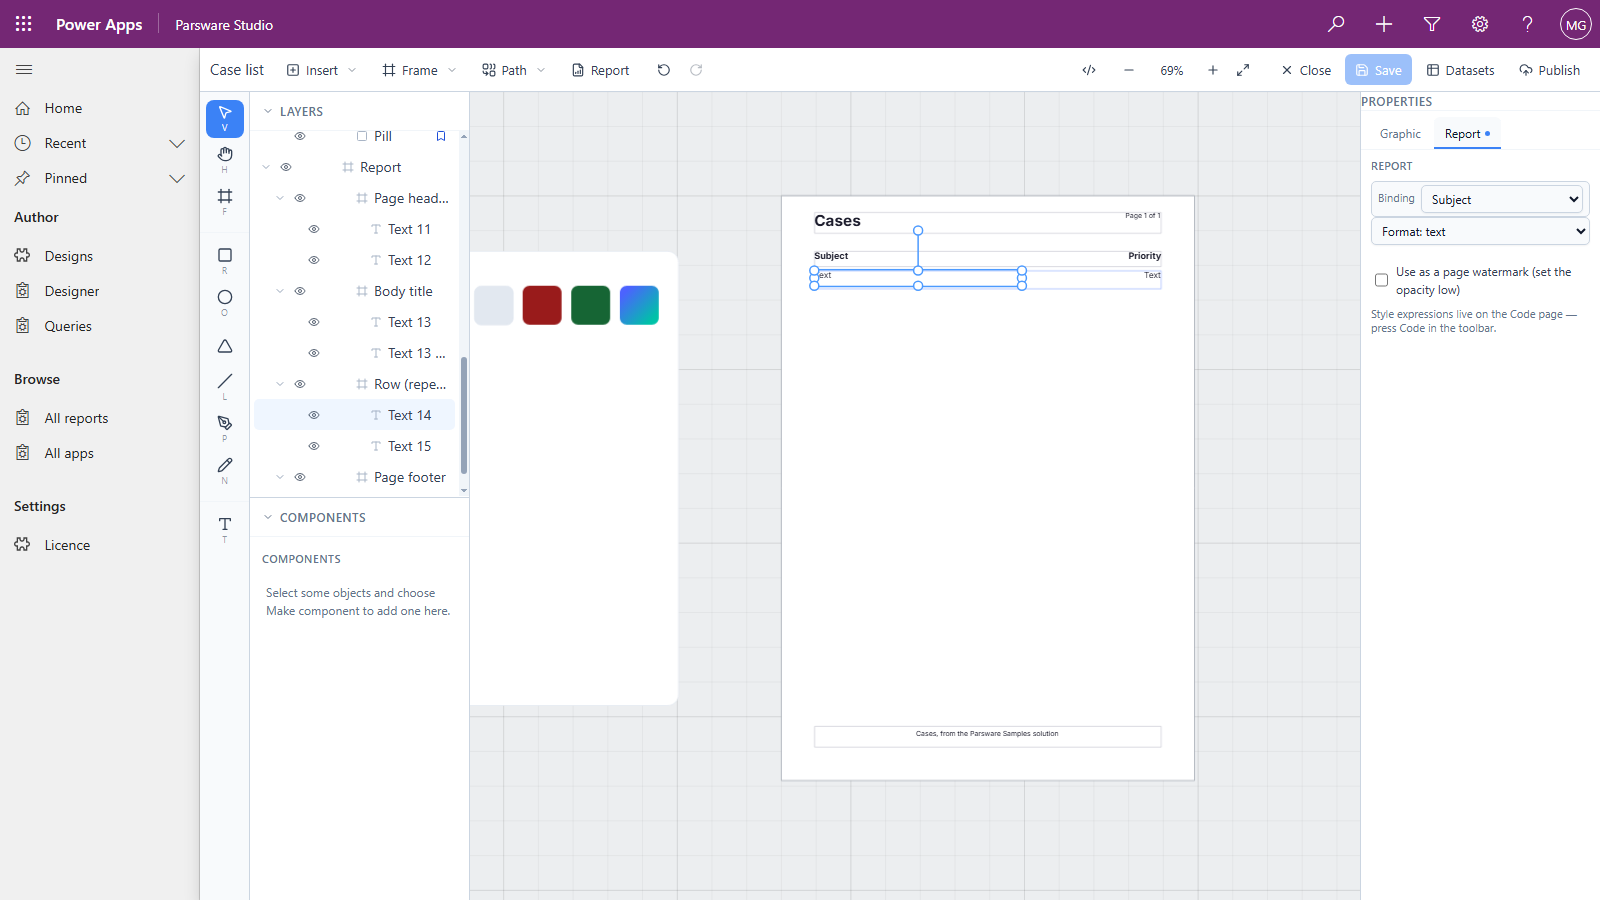
Select the right-hand box and bind it to Priority. Then check its Format: the template starts that box as currency, and a priority isn't money, so set it to text.
Last, the words. Select a text box, open the Graphic tab and change its text. We set the title to Cases, and the two headings to Subject and Priority, the second duplicated from the first with Ctrl+D, moved to line up over the priority column and aligned right. Press Save.
6. Preview it
Press Report in the toolbar. The preview runs the report against real rows, as you, straight from what you just saved:
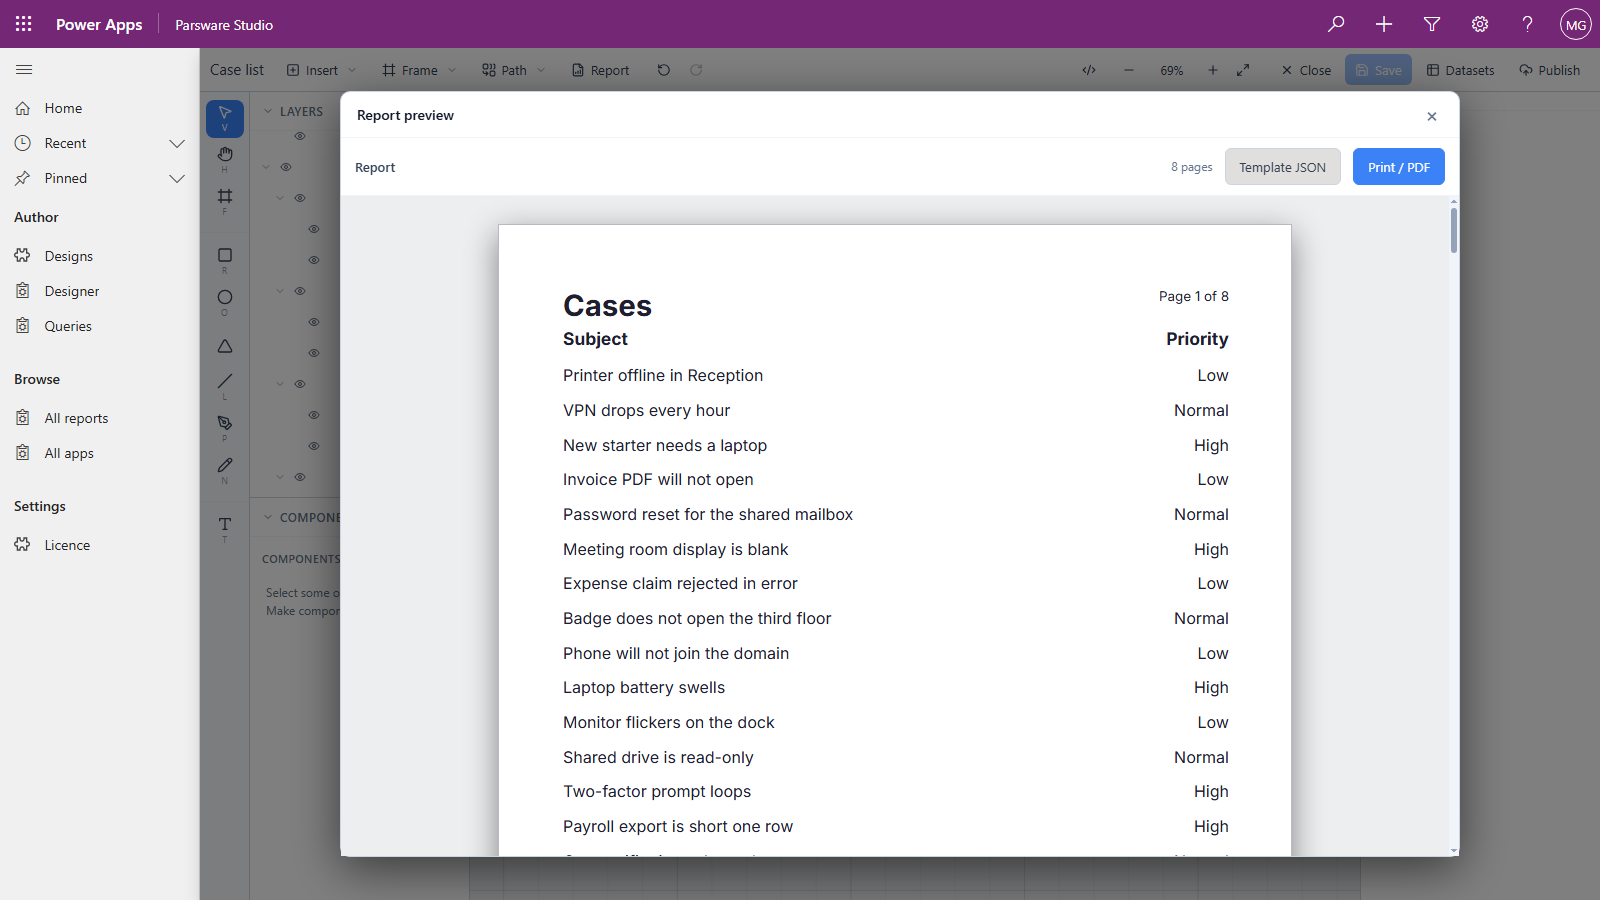
Three things happened there that you didn't have to do:
- The row repeated once per case, and the report broke onto a new page whenever the page filled: 200 cases, eight pages.
- The page header printed on every page, and Page 1 of 1 became Page 1 of 8.
- Priority printed as its label, Low, Normal or High, not as the number Dataverse stores for a choice.
Print / PDF in the preview prints it. The preview runs in the designer only, though: nobody else can see this report yet.
What you have, and what's next
You have a draft. It's saved and it shows up under All reports in Parsware Studio, but no user's app can open it, and that's the point. You can keep changing it without anybody seeing a half-finished page. Publish is the separate step that releases it into one of your own solutions, and it has its own article later in this series.
Next: reports from a view, so the report reads only the rows a view picks, in the view's order. The whole series is in the reading list.