Parsware Platform
Totals and groups
A Parsware query can answer "how many" and "how much" as well as "which". Group records by a column, count and sum them, keep only the groups that pass a test, and take the top five, all in the query designer, with the database doing the arithmetic.
این مقاله فقط به انگلیسی در دسترس است.
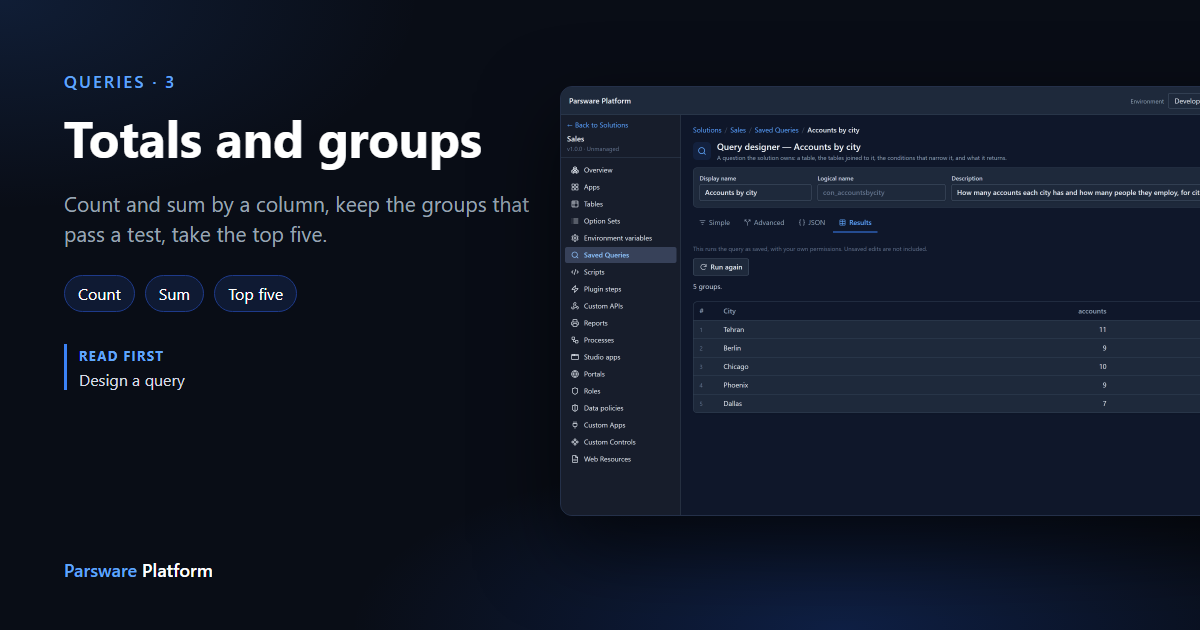
Most queries answer which records: these contacts, those invoices. A chart or a counted tile needs a different answer: how many, and how much. In Parsware the same query designer asks both. You tick one box, and the query returns groups with totals instead of records.
This article builds Accounts by city: how many accounts each city has and how many people they employ, for cities with at least seven accounts, the five biggest workforces first. It uses the Account table every environment starts with, in a solution of our own called Sales. Every picture is the real product.
Groups instead of records
Open your solution, choose Saved Queries, then New. Name the query, choose the Account table, and go to the Advanced tab. Under Group and measure, tick Return groups instead of records. Three lists appear:
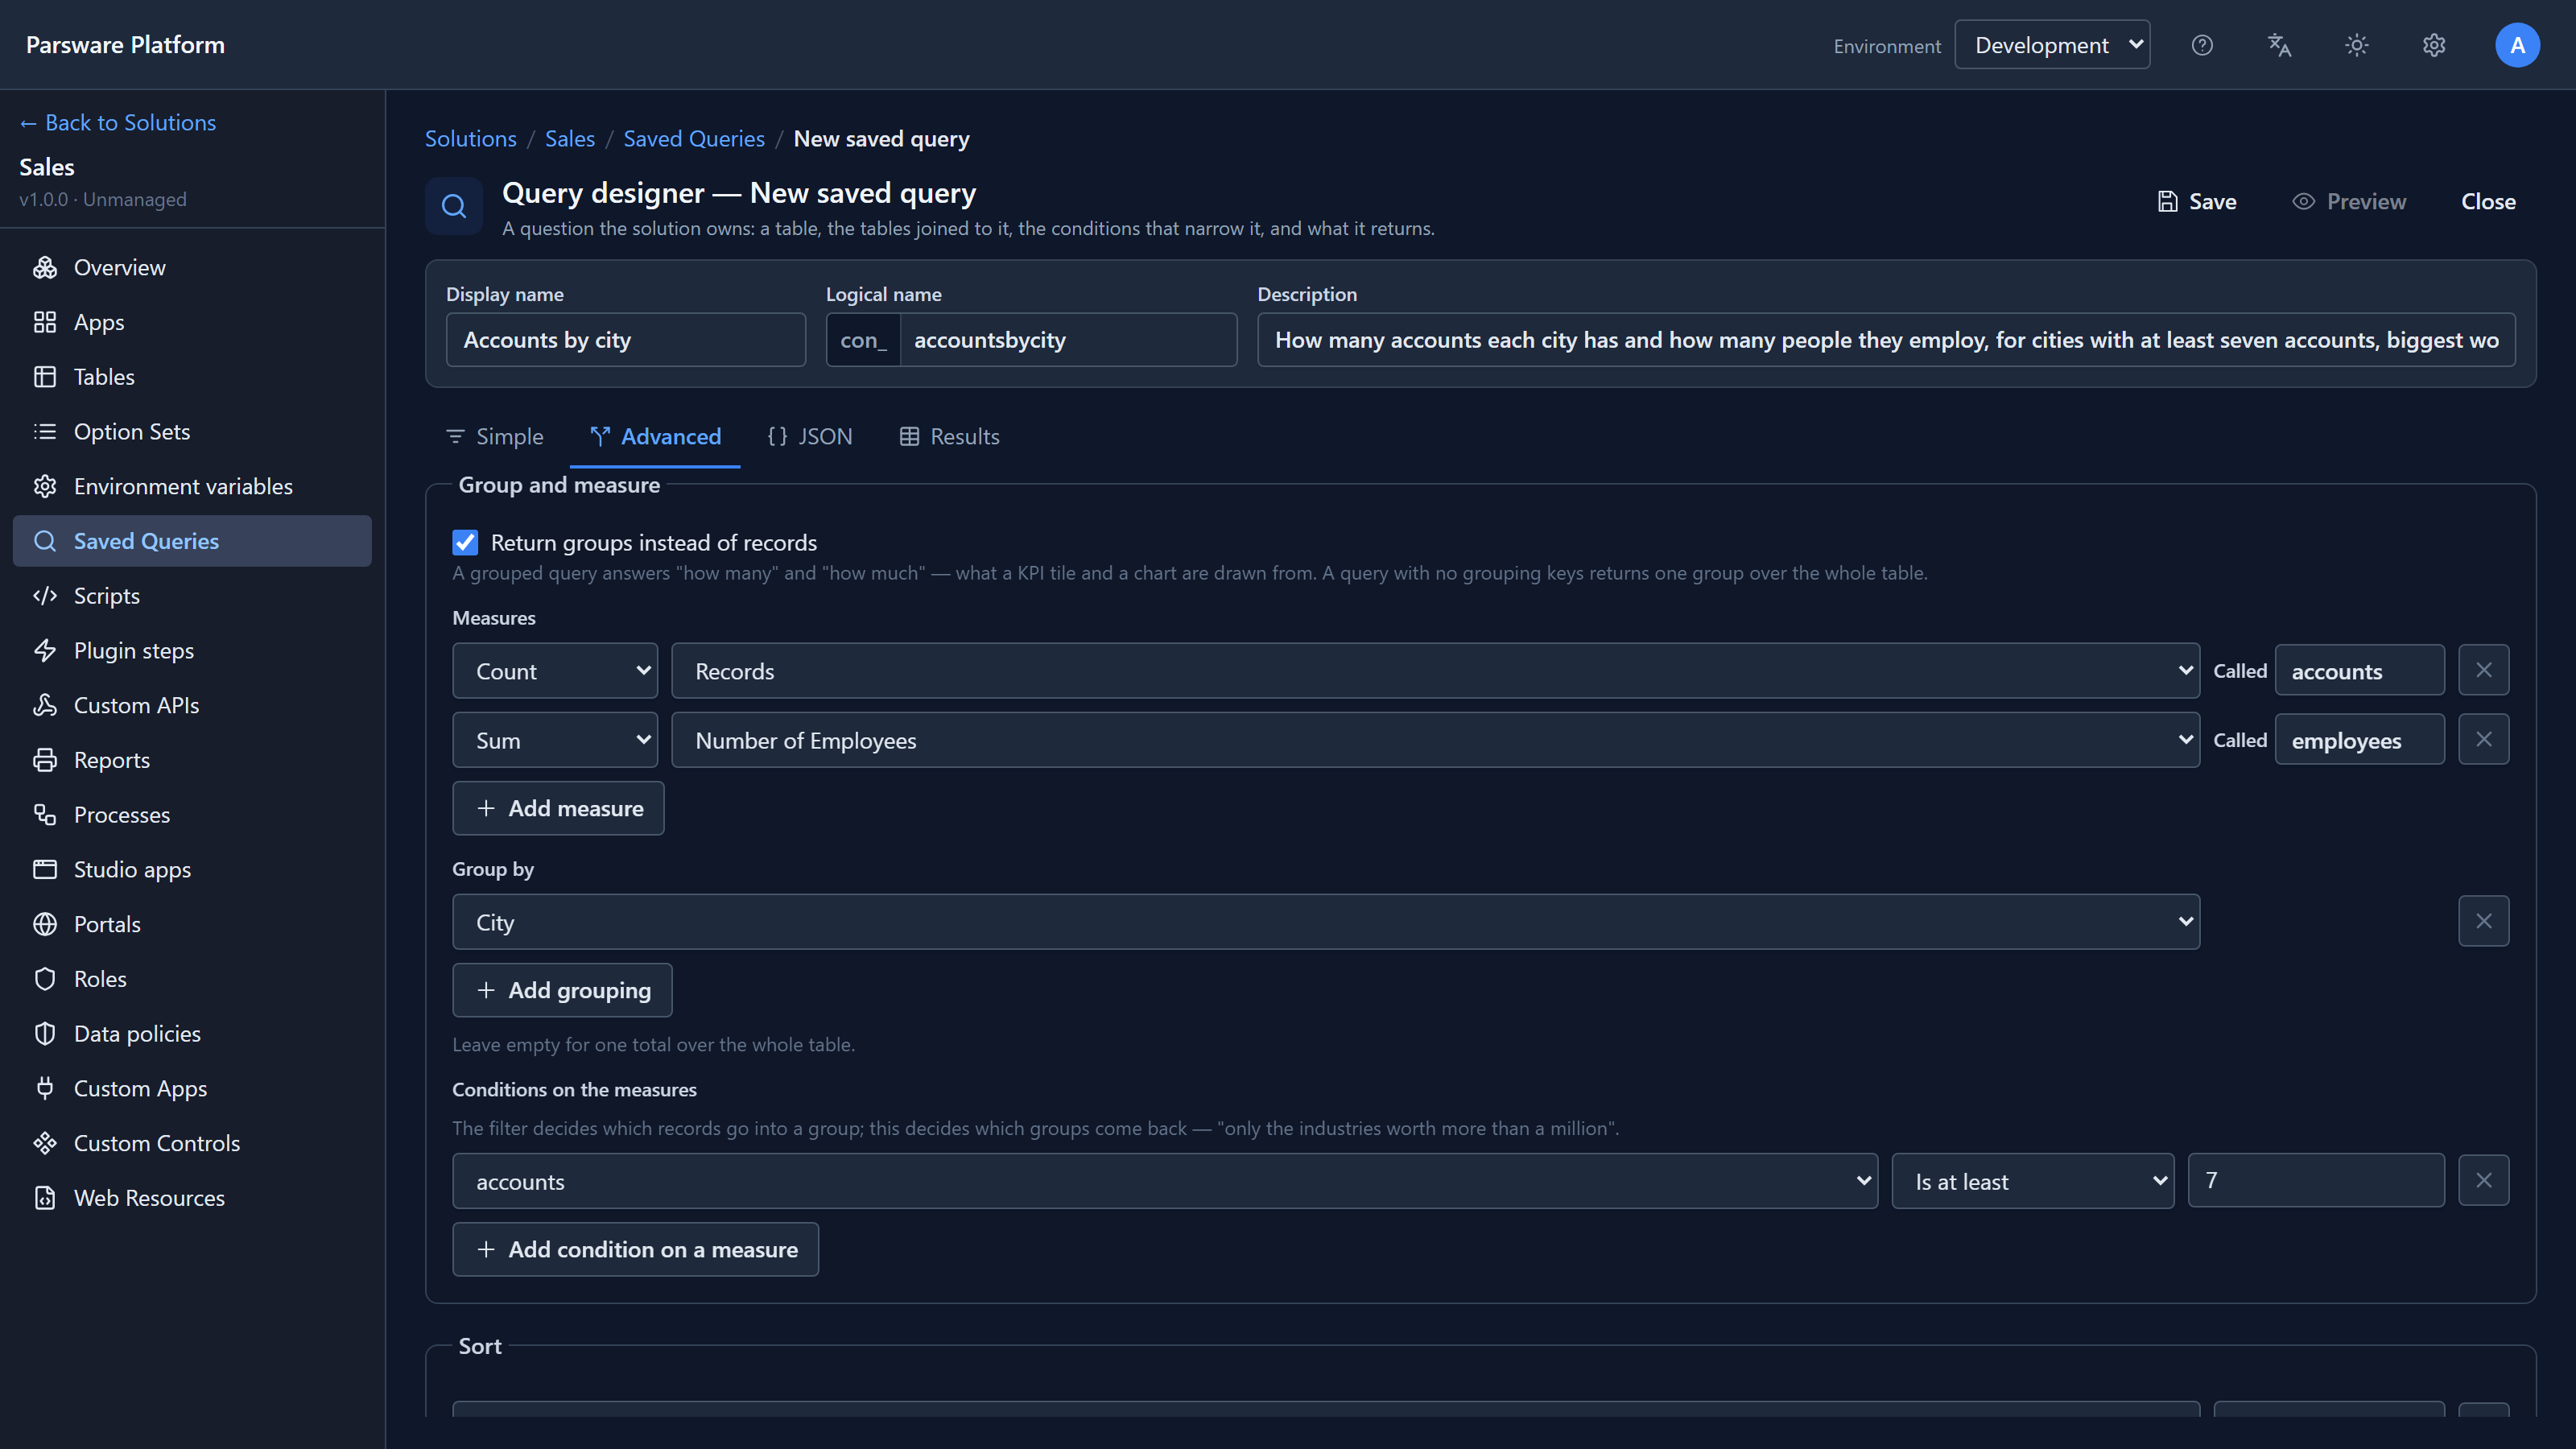
- Measures say what to work out. We added two: Count of records, called
accounts, and Sum of Number of Employees, calledemployees. The functions are Count, Sum, Average, Minimum and Maximum. Sum and Average offer only number columns. - Group by says what to split them by. We chose City. You can use up to two keys, and a date column also offers a period: day, week, month, quarter or year.
- Conditions on the measures say which groups come back. We asked for cities with at least 7 accounts.
The name you give a measure matters. It's the name the result comes back under, and the name a chart or a script reads.
Leave Group by empty and the query returns one group over the whole table: a single total, which is what a counted tile shows.
A filter or a condition on a measure?
They look alike, but they answer different questions.
- The filter decides which records go into a group. "Accounts in the United States" is a filter: each account knows its own country.
- A condition on a measure decides which groups come out. "Cities with at least seven accounts" can't be a filter, because no single account knows how many accounts share its city. Only the group does.
You can use both in one query: filter the records first, then keep only the groups you want.
Sort, and the top five
A grouped query has no ordinary columns to sort by: its rows are groups. So Sort offers the
grouping key and the measures. We sorted by employees, descending, and set Return at most to
5:
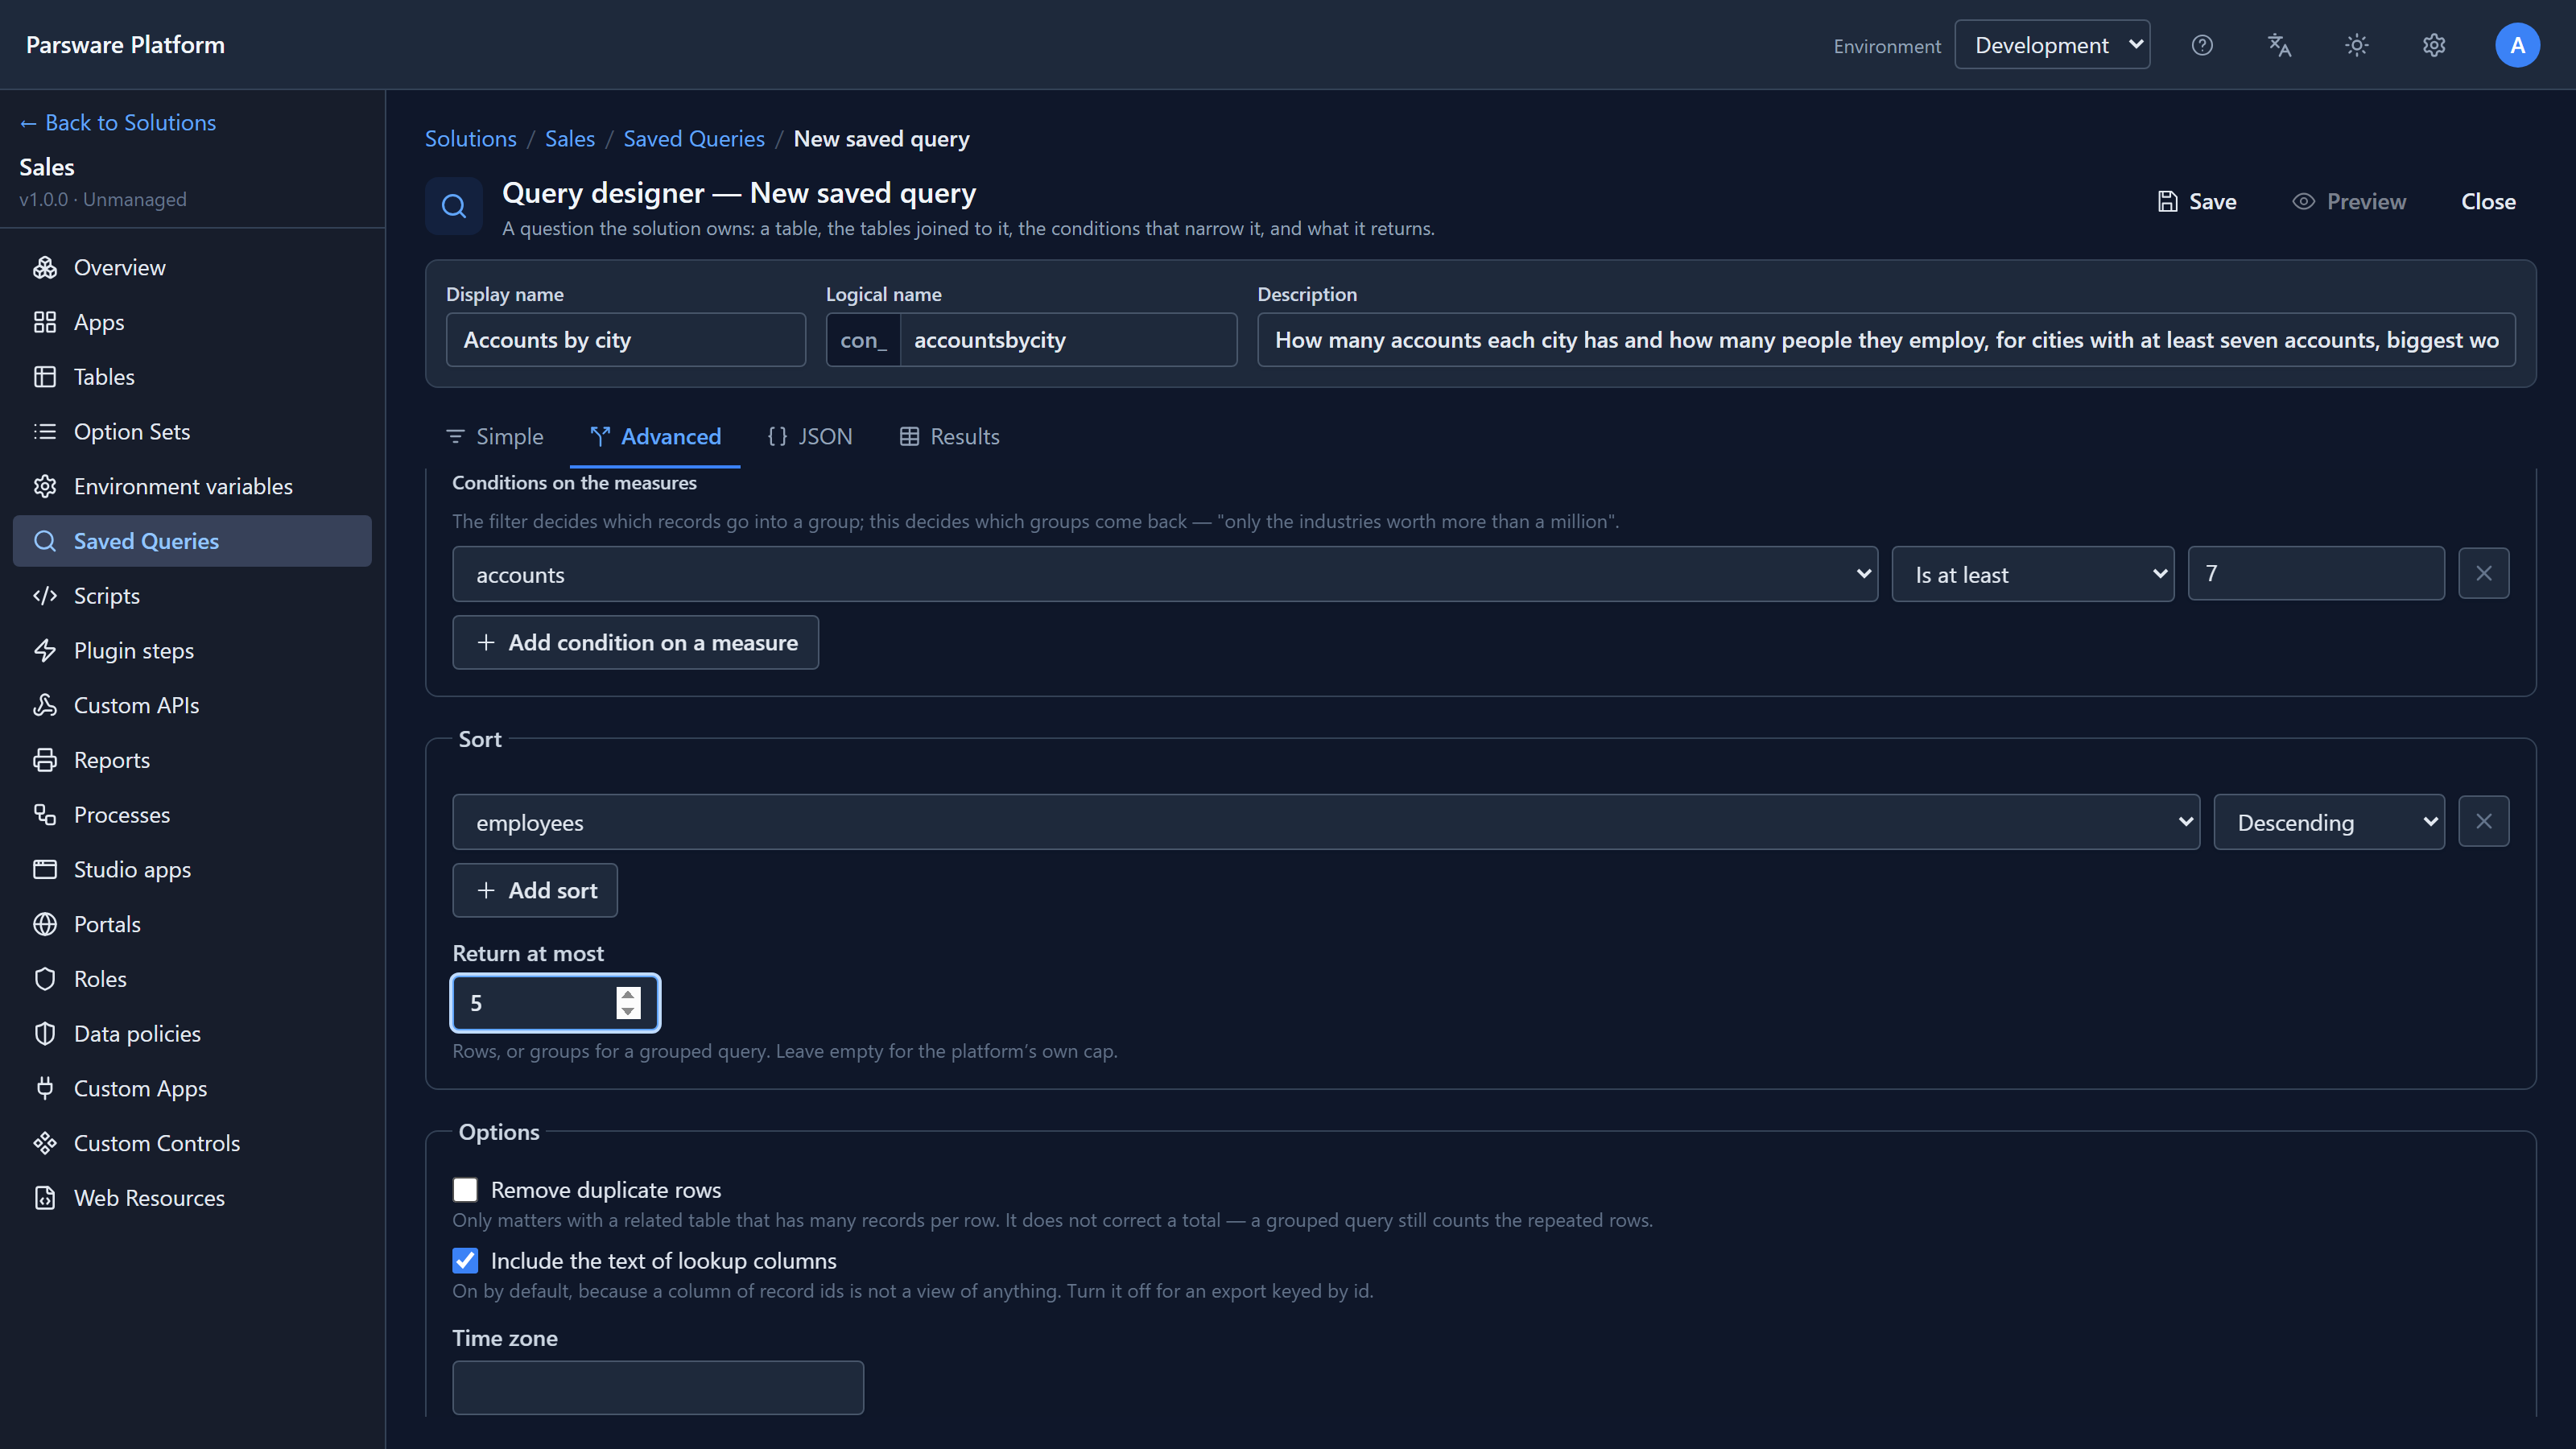
That is the usual "top five" question: sort by a measure, biggest first, and cap it.
Save, then look at the answer
Save checks that every field, grouping and measure exists in this environment. Preview runs it:
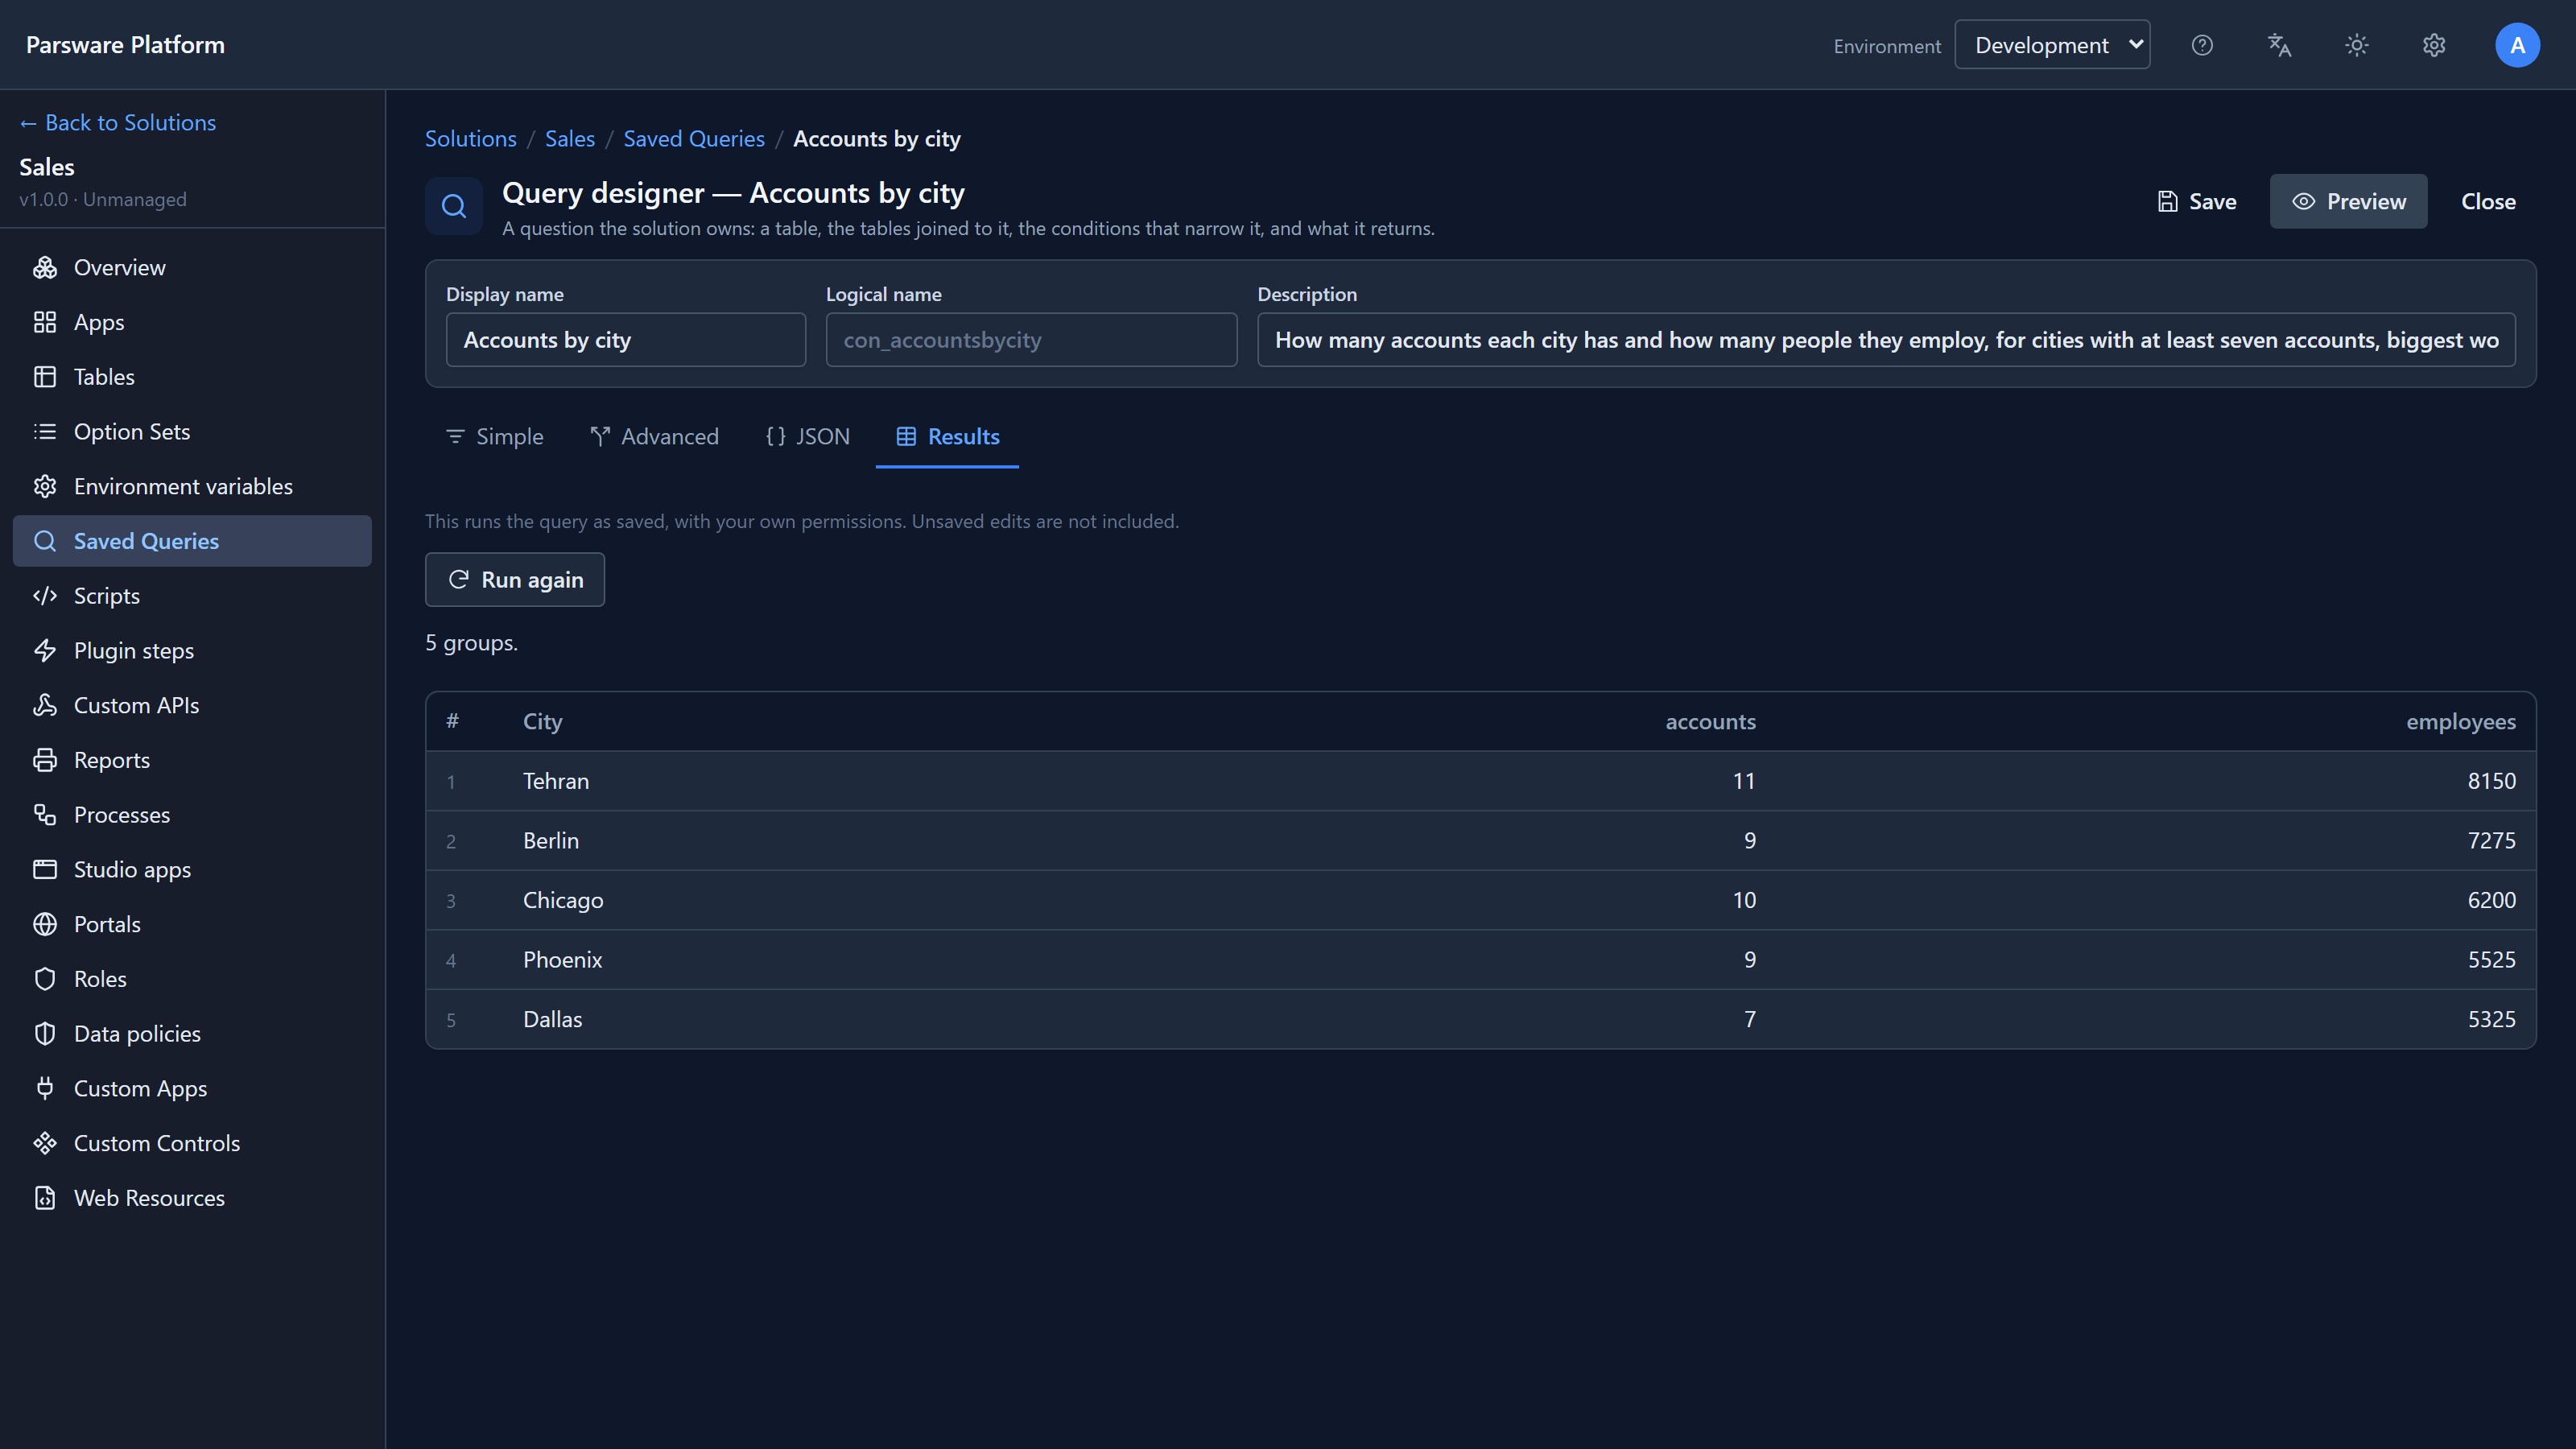
Five cities, with their counts and totals, biggest workforce first. Chicago has more accounts than Berlin but fewer people, so it comes third. The database did the counting and adding. The query never fetched a single account to do it, so it gives the same answer for fifty accounts or fifty thousand.
While writing this we found that this table headed the city column address1_city, the column's
internal name, even though record queries already showed display names. It now reads City.
The query is a document
The JSON tab shows what you built. The two measures, the grouping and the condition are all
under aggregate, and the condition on the measures is called having, as in SQL:
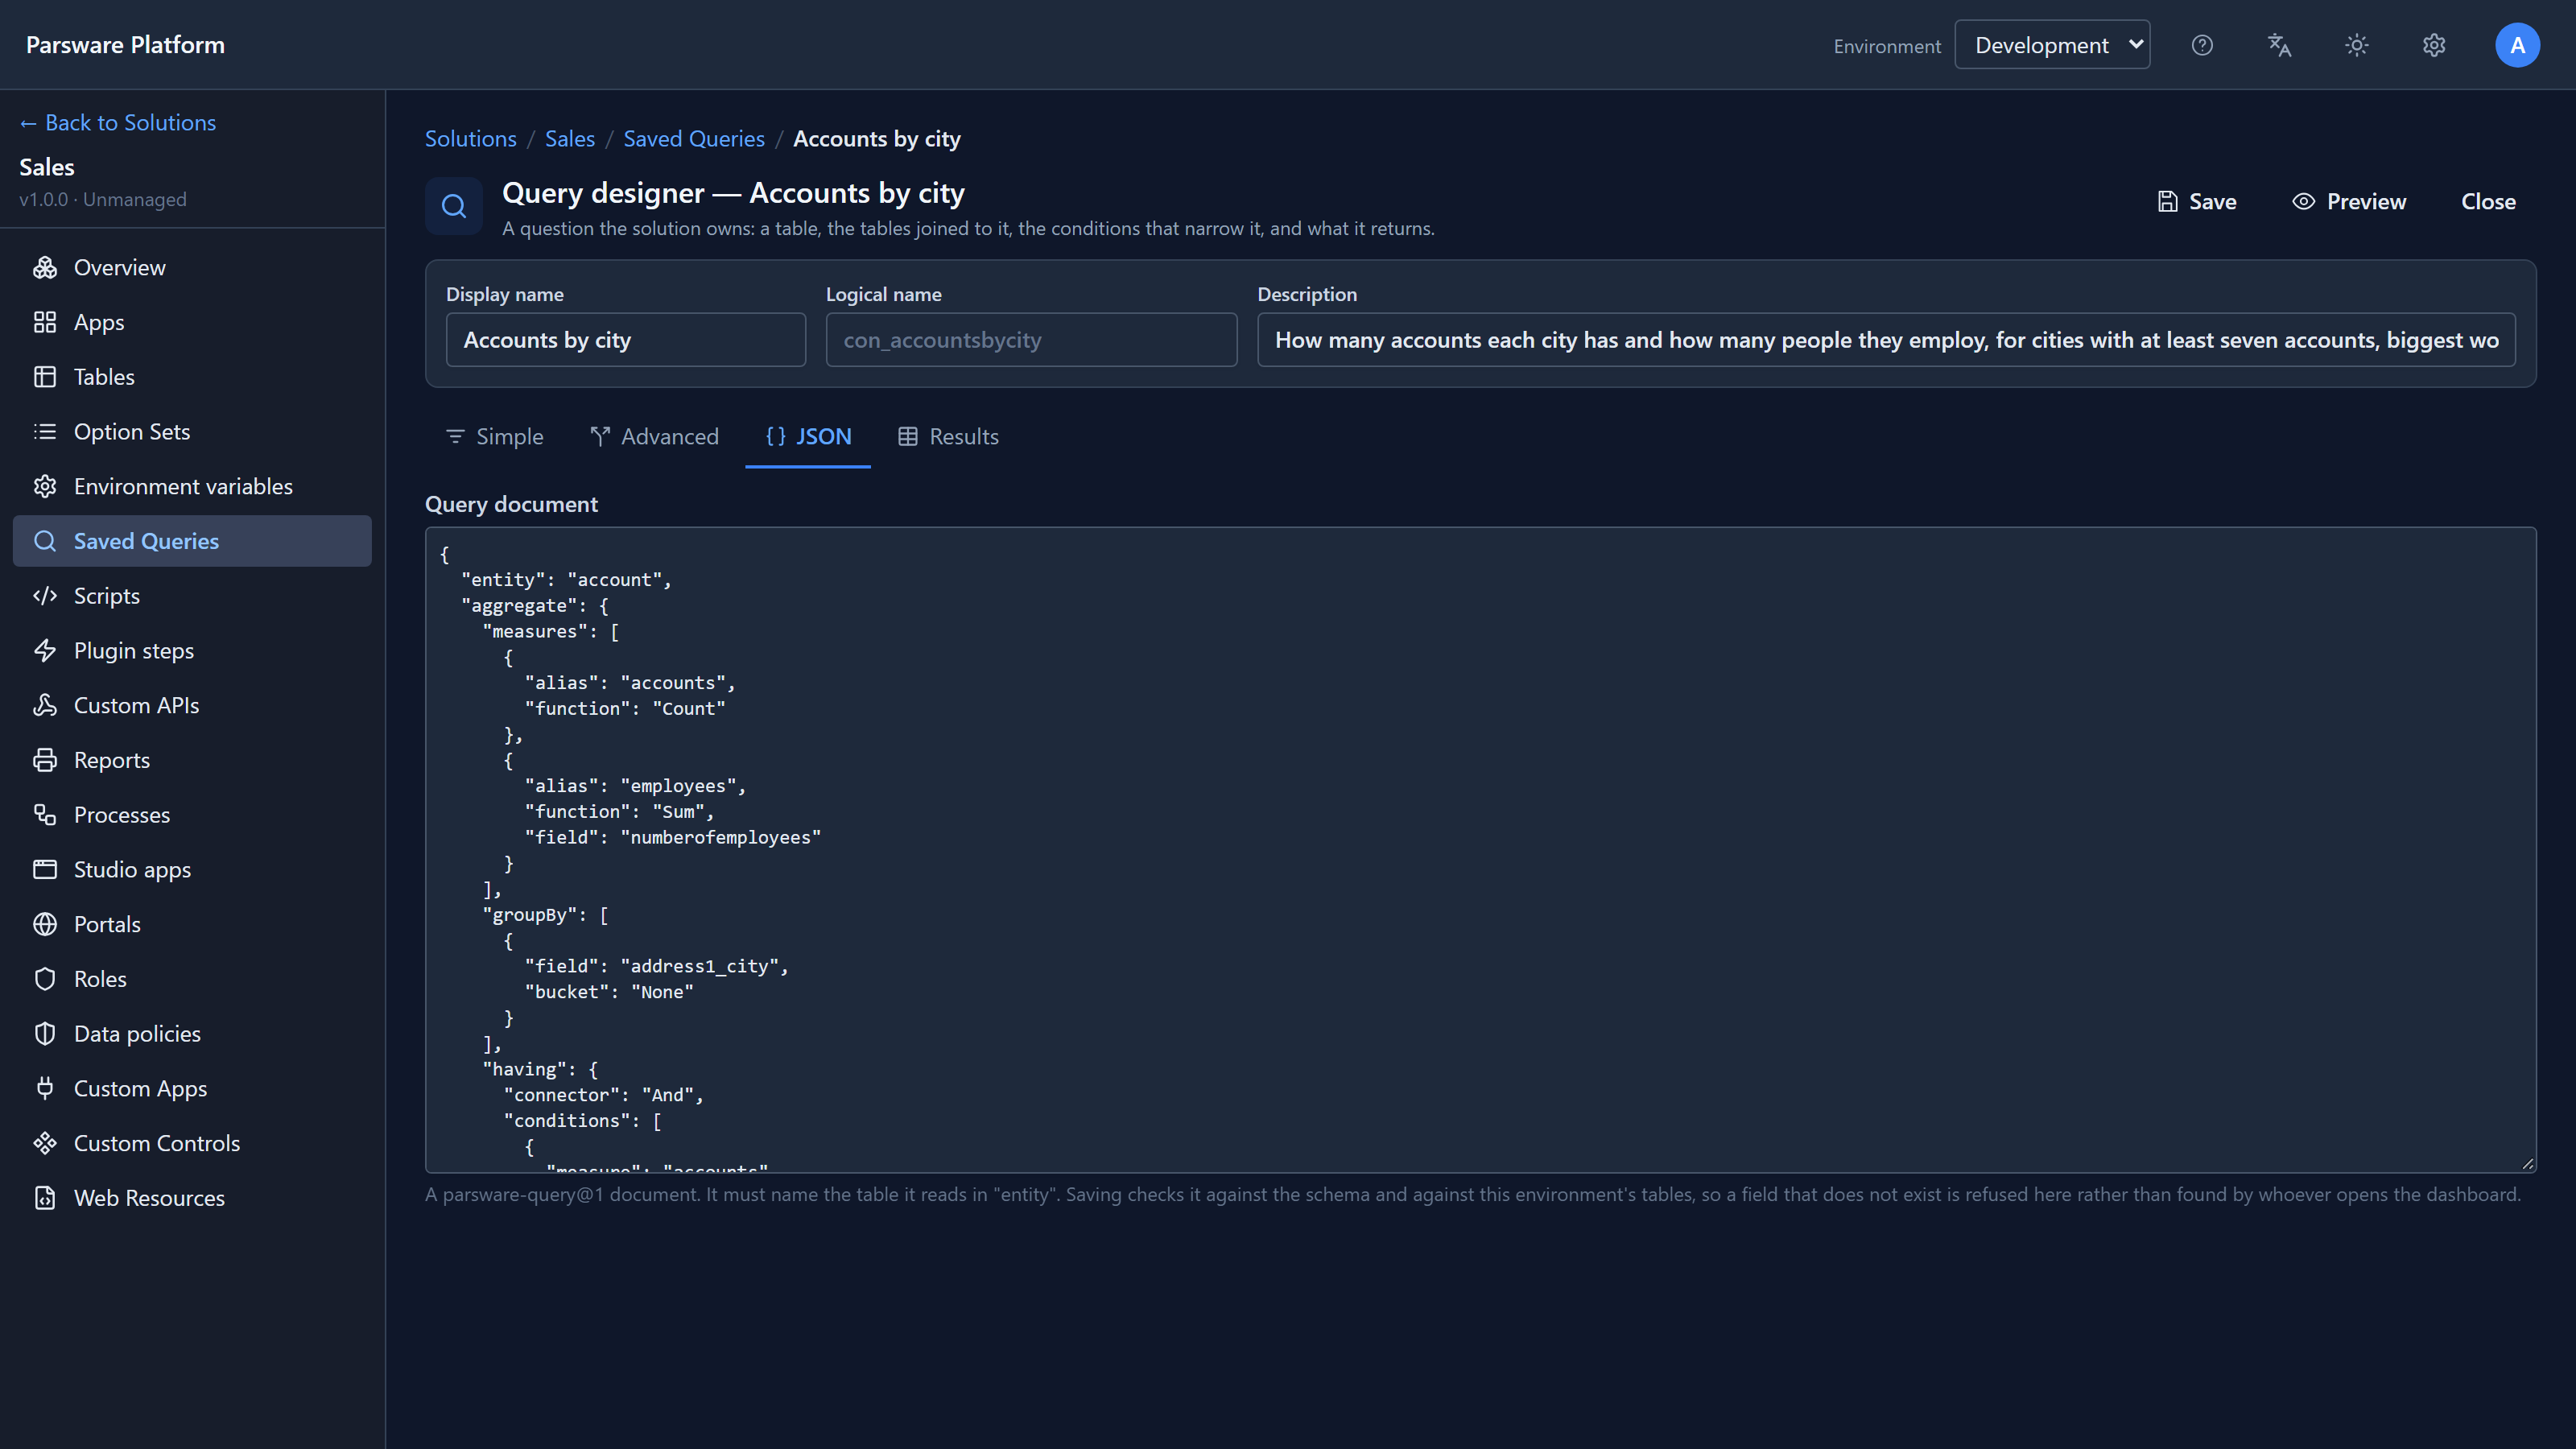
A report, a script or a custom app that names this query gets these five groups. Each group has the
key and the measures by name, such as address1_city, accounts and employees.
Two things that catch people out
A sum over nothing is empty, not zero. Group by nothing and filter to a customer with no invoices, and you still get one group. Its Count is 0, but its Sum is empty, exactly as in SQL. A script has to check for that before it adds the total to anything. We found a sample plugin step that didn't, which is in the previous article.
A join can double a total. If you join a table the "many" way, such as an account's contacts, each account comes back once per contact. Sum the account's employees after that join and every account is counted as many times as it has contacts. Remove duplicate rows doesn't fix this, because a grouped query still counts the repeated rows. Join the "one related record" way when you total, or group by the table you're totalling.
Next: BS Lang, the one scripting language every script in Parsware is written in.