Parsware Platform
A dashboard in an app
A dashboard in Parsware is a screen you draw. Counted tiles, charts, the table's own grid and its quick create form sit on one page, and the page goes into an app's navigation like any table.
این مقاله فقط به انگلیسی در دسترس است.
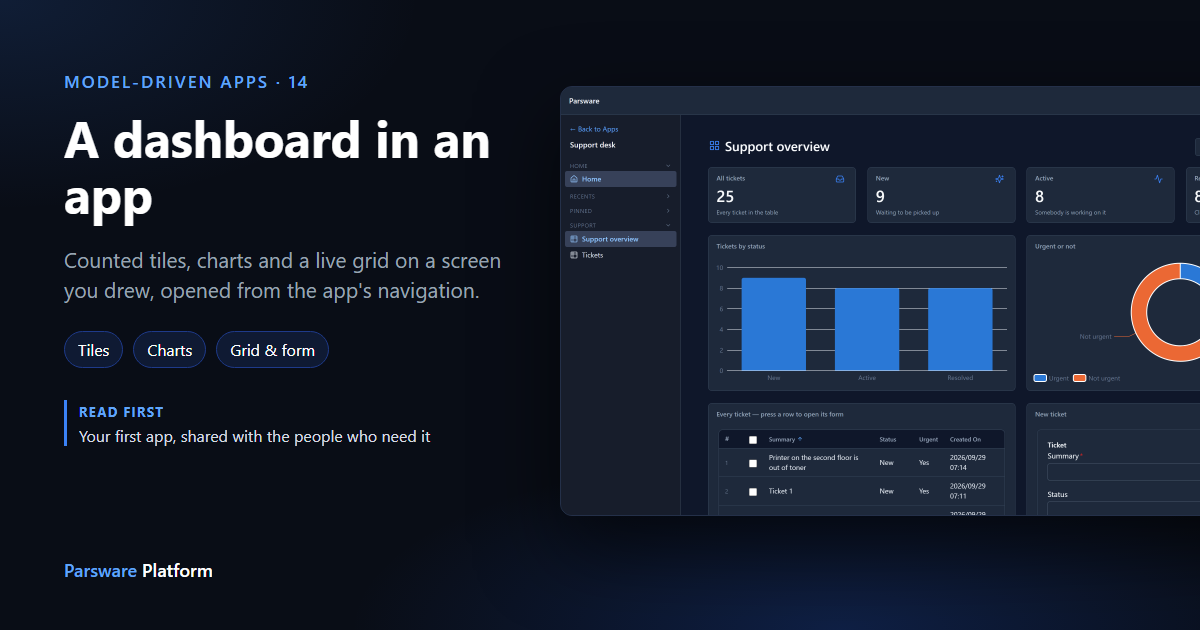
A list of rows answers "which ones?". A dashboard answers "how many, and where are they piling up?". In Parsware a dashboard is a drawn screen: you lay out the page in the Application Studio, and the numbers, charts and grids on it are live. Then you put the screen into an app's navigation, next to its tables.
This article uses the studio-dashboard sample. Import it into an environment and open Support overview from the apps list. Every picture is the real product.
What's in the sample
Ticket is a small table: a Summary, a Status choice (New, Active, Resolved) and an Urgent yes/no. It comes with a quick create form, a main form and an All tickets view. The sample's app is one drawn screen, Overview.
The table starts empty, so press Add 24 tickets first. The screen creates them itself, cycling the status and marking every third one urgent:
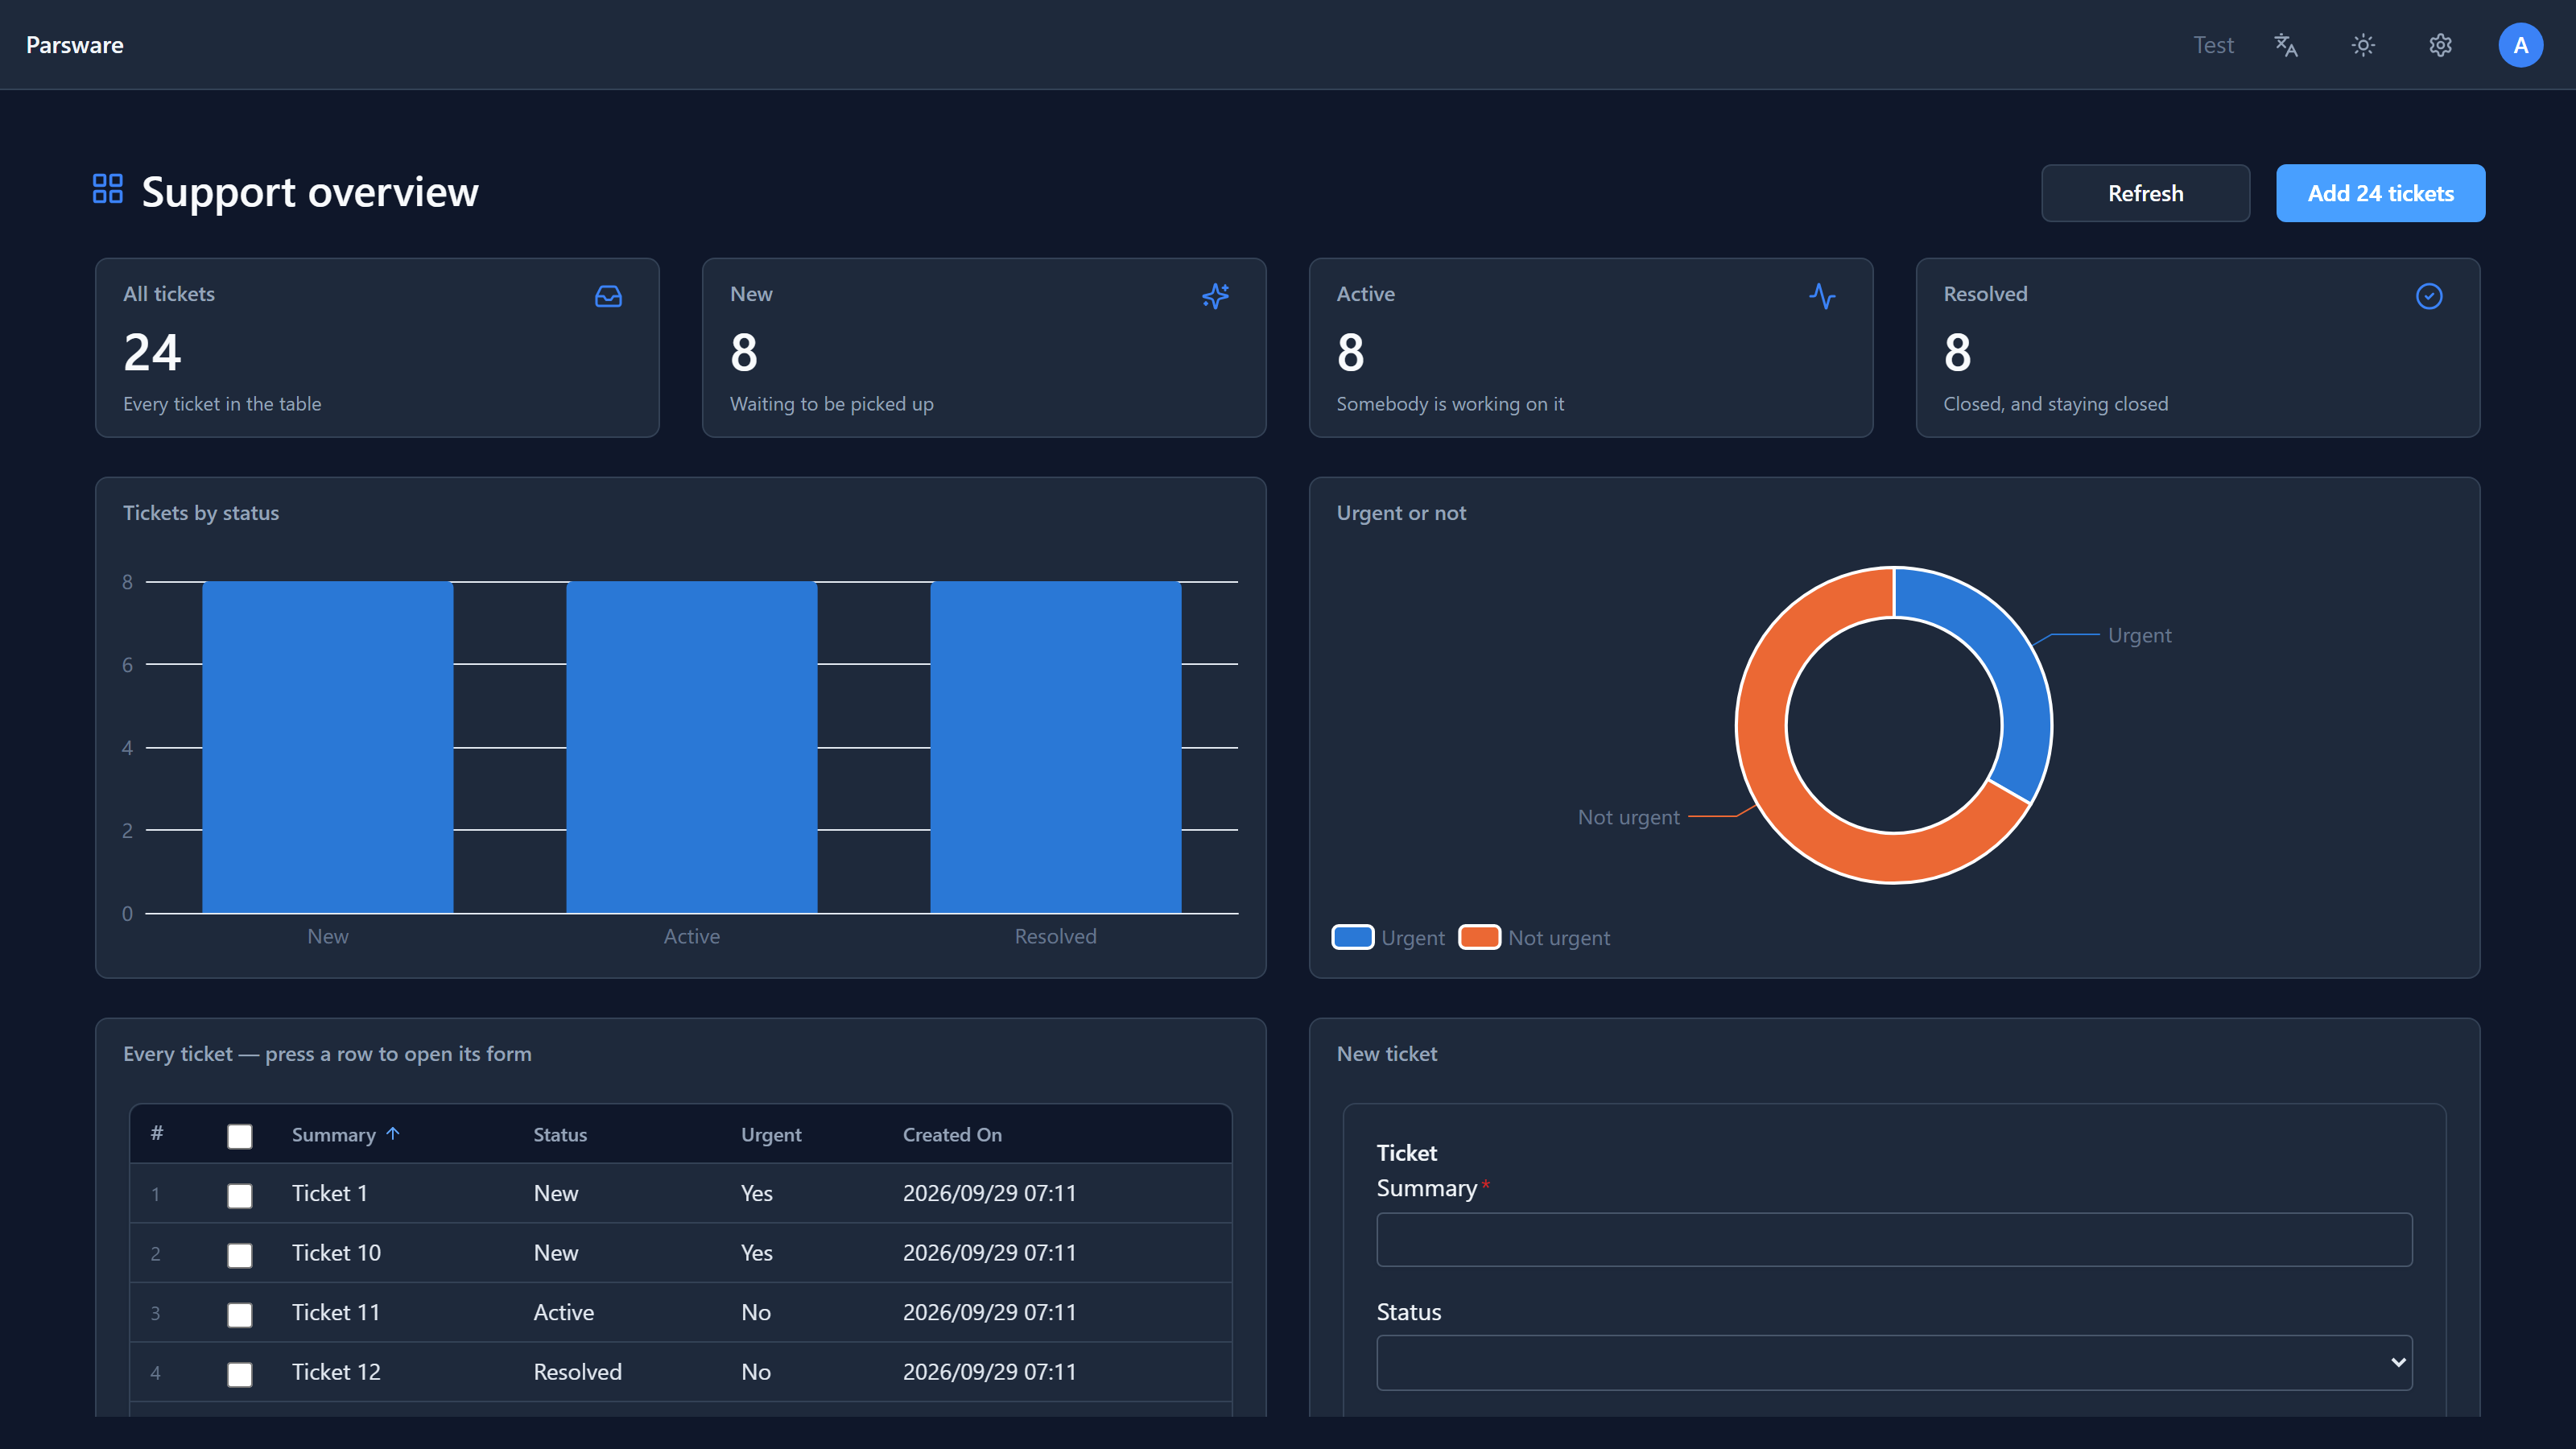
Before you add any, the charts say No tickets yet instead of drawing empty axes. That sentence is part of the drawing, shown only while the total is zero.
Add a ticket from the page
The New ticket panel is the table's own quick create form. Its fields, its required rules and its business rules are the same ones the table has everywhere:

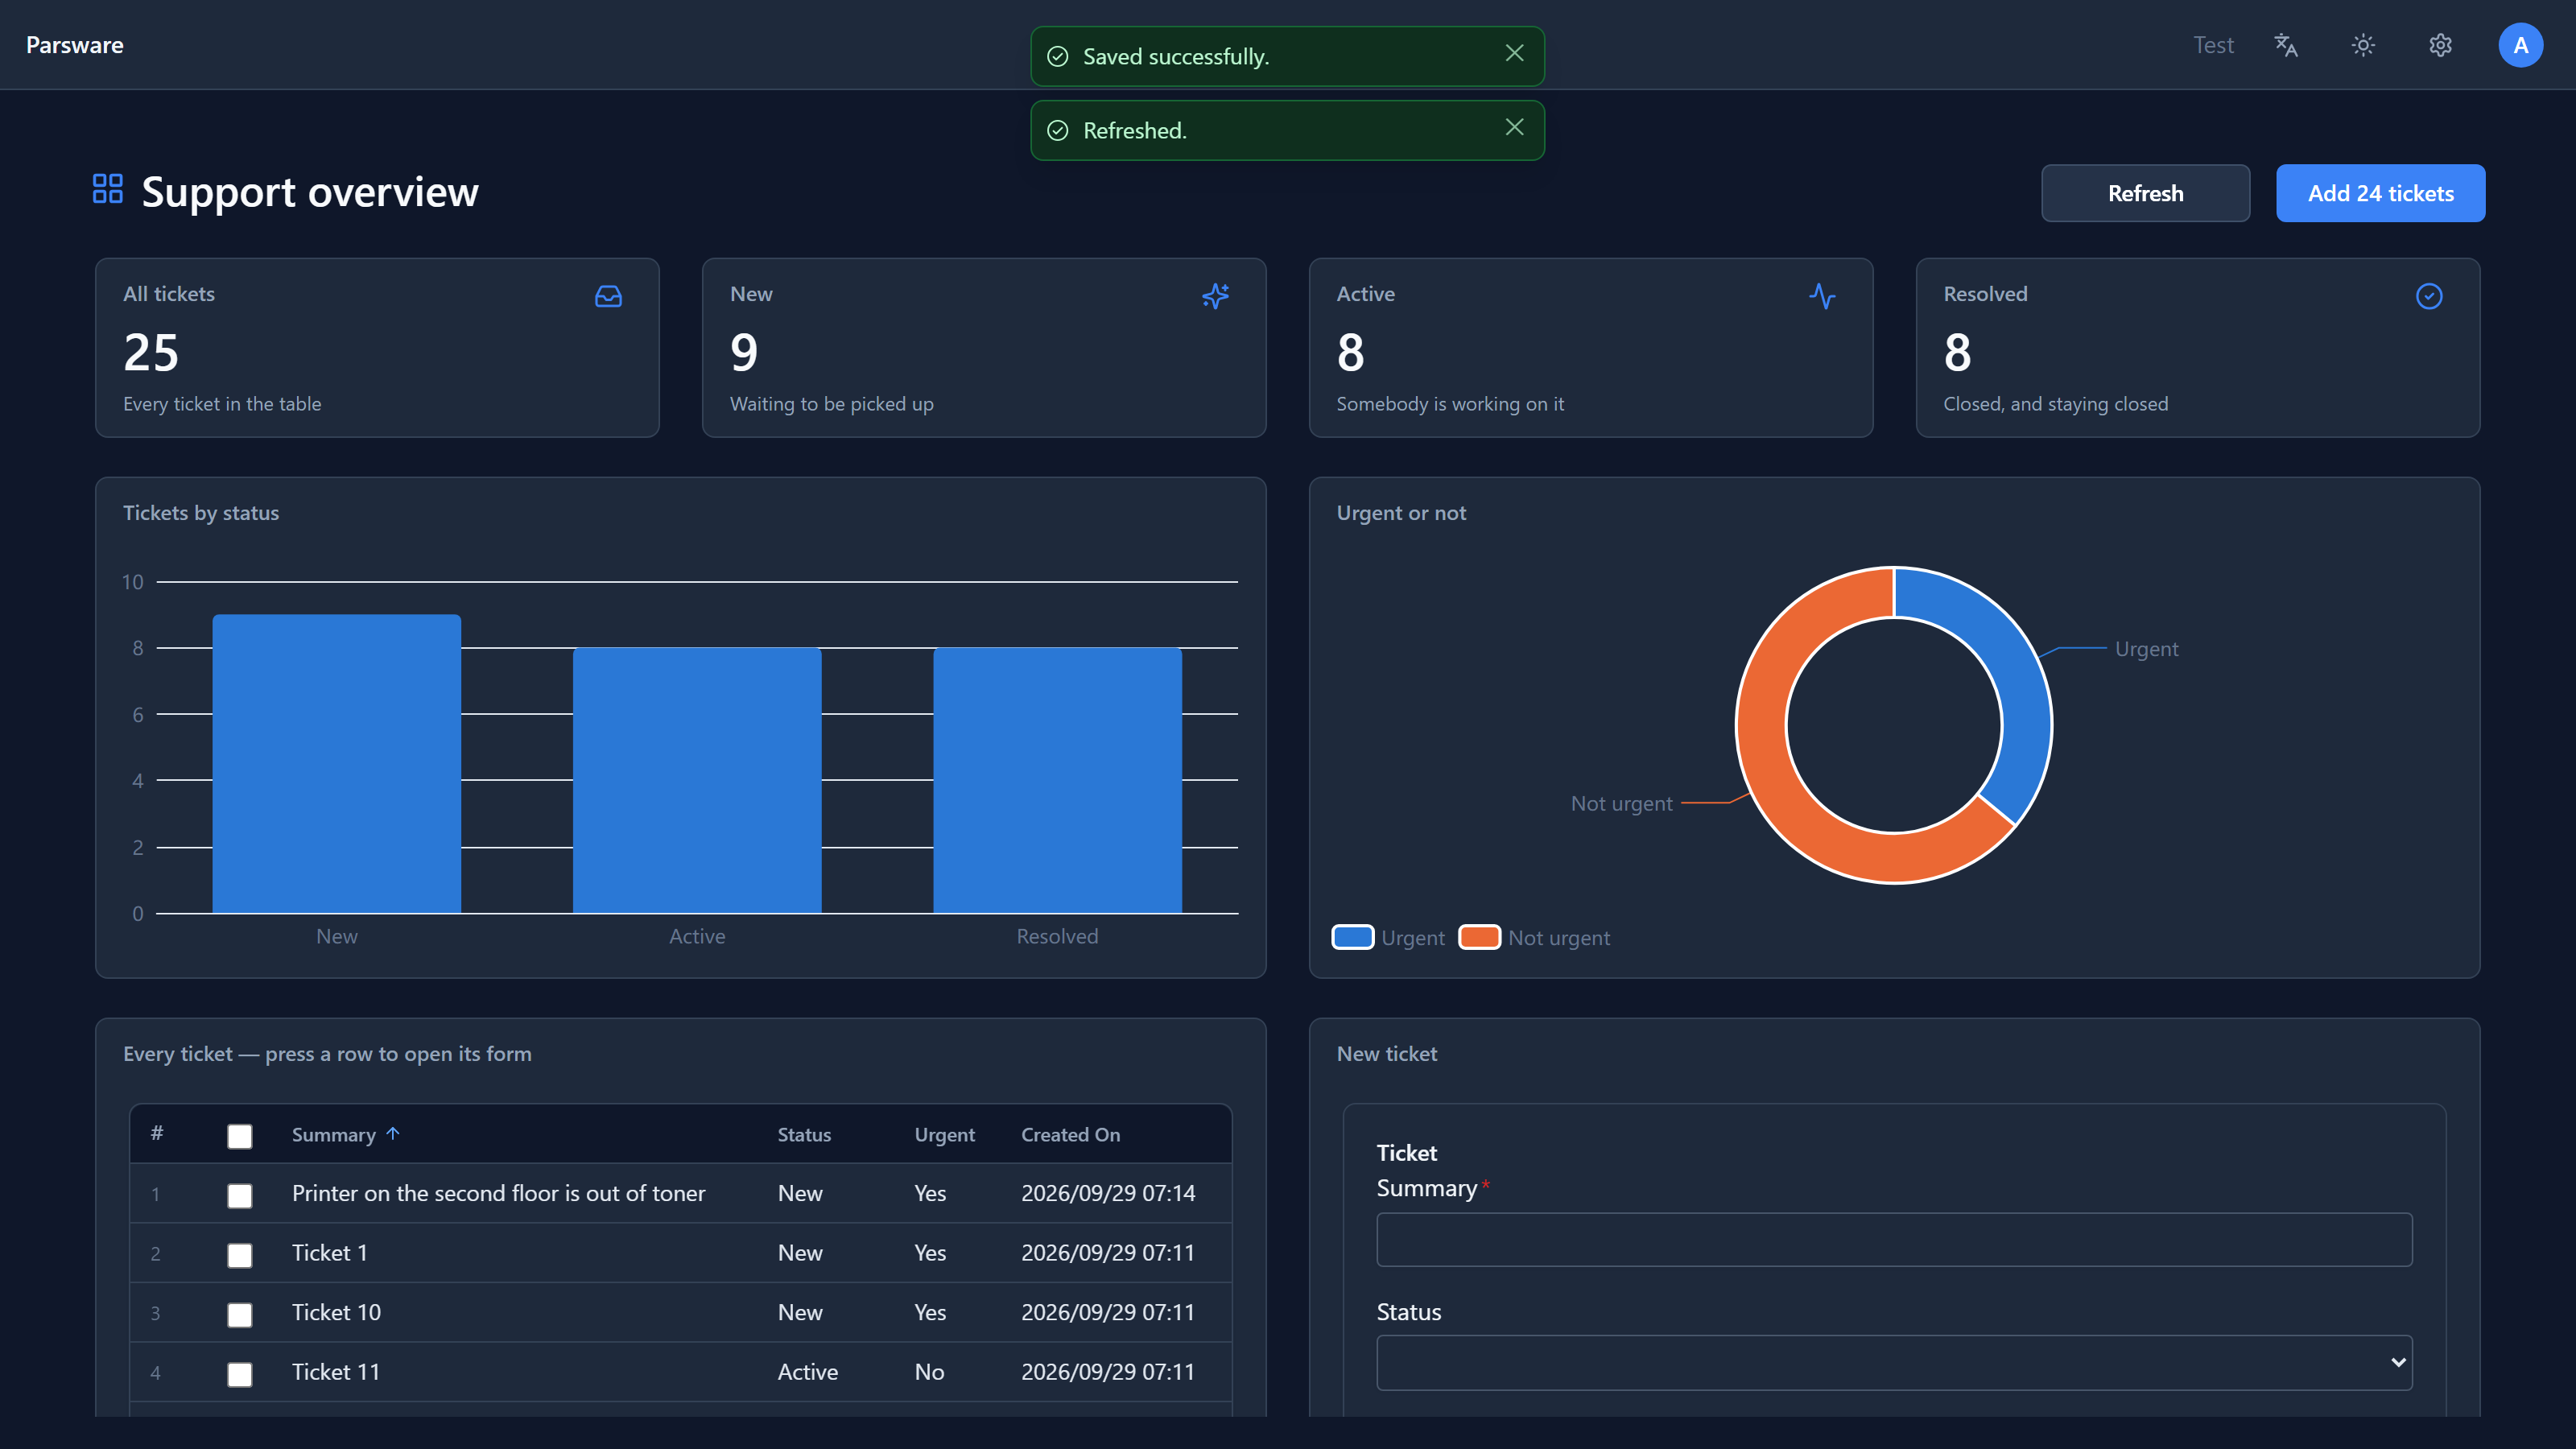
Save it, then press Refresh. The tiles, the chart and the grid all move together:
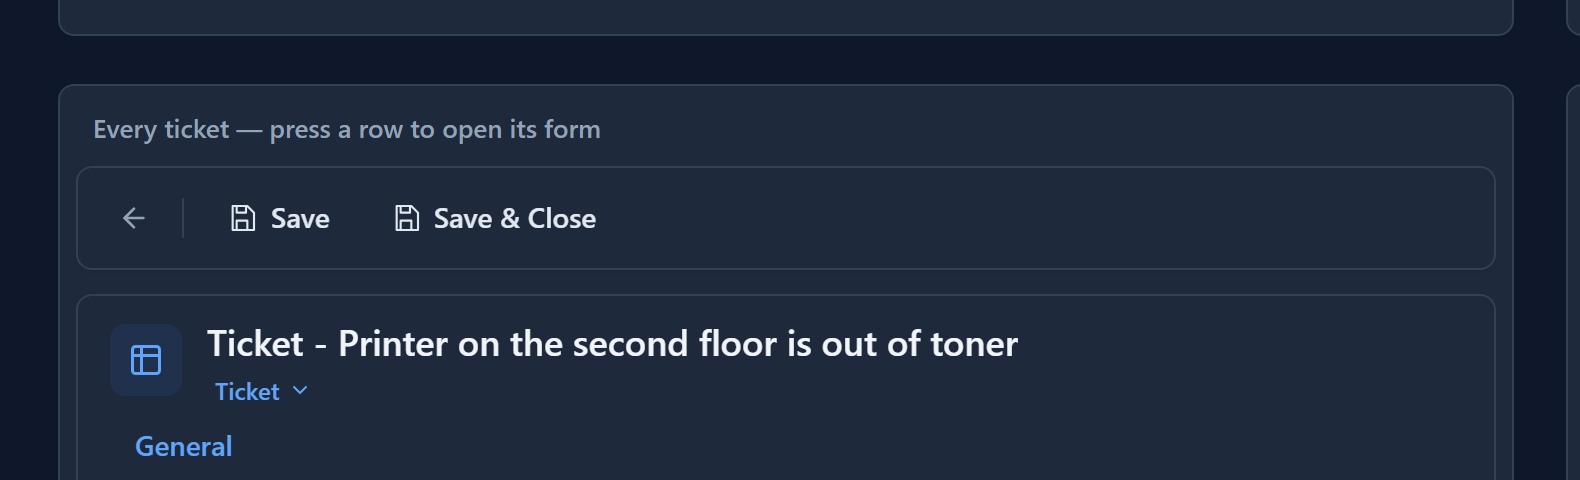
Press a row in the grid and the ticket's form opens in the panel, with a back arrow to return to the list:
How the numbers are counted
Open the app in the Application Studio and press </> to write code. The screen's Screen opens handler runs one query per number:

countInto is where the number of matching rows goes, not the number that came back. top: 1
keeps the page of rows as small as it can be, because nobody reads it. Each tile's big number is
then a text bound to text(state.total), text(state.statusNew) and so on.
The Refresh button runs the same six lines again.
Charts
Components → Chart draws the platform's own chart: bars, stacked bars, line, area, pie or donut. Its Value is a list of labels and numbers built from those counts:

You draw where the chart goes and how big it is. The chart itself decides the ticks, the labels and what to do with an odd value, every time it draws, so it copes with data you didn't design against.
The grid and the form are the real ones
Components → Table view or form embeds a model-driven surface. Shows picks a view's rows, a form for a new record, or a form for one record; Table and View (or Form) name what to show:
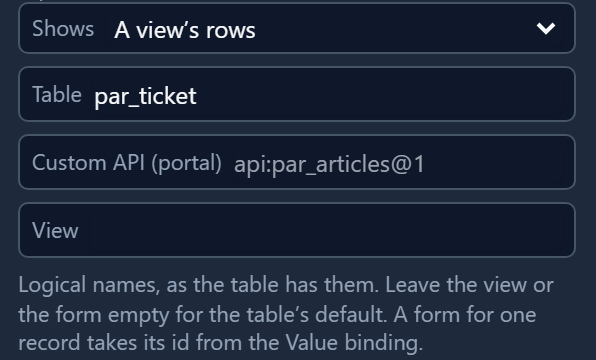
What appears is the same grid a model-driven app shows, with its own sorting, paging and permissions per record, and the same quick create form. Nothing is redrawn, so a field that is required on the table is required here too.
Your own queries don't reach inside those surfaces. After a handler writes records, it ends with
reloadSurfaces(), which starts every embedded grid and form again.
While writing this we found that Add 24 tickets left the grid empty beside tiles reading 24.
Record writes wait until the handler finishes, but reloadSurfaces() ran straight away, so the
grid reloaded before any ticket existed. It now waits its turn like the writes do, and the grid
fills in with the tiles. We also found the sample had no quick create form or view of its own, so
its New ticket panel said there was nothing to show. Version 1.1.0 of the sample has both.
Put it in an app
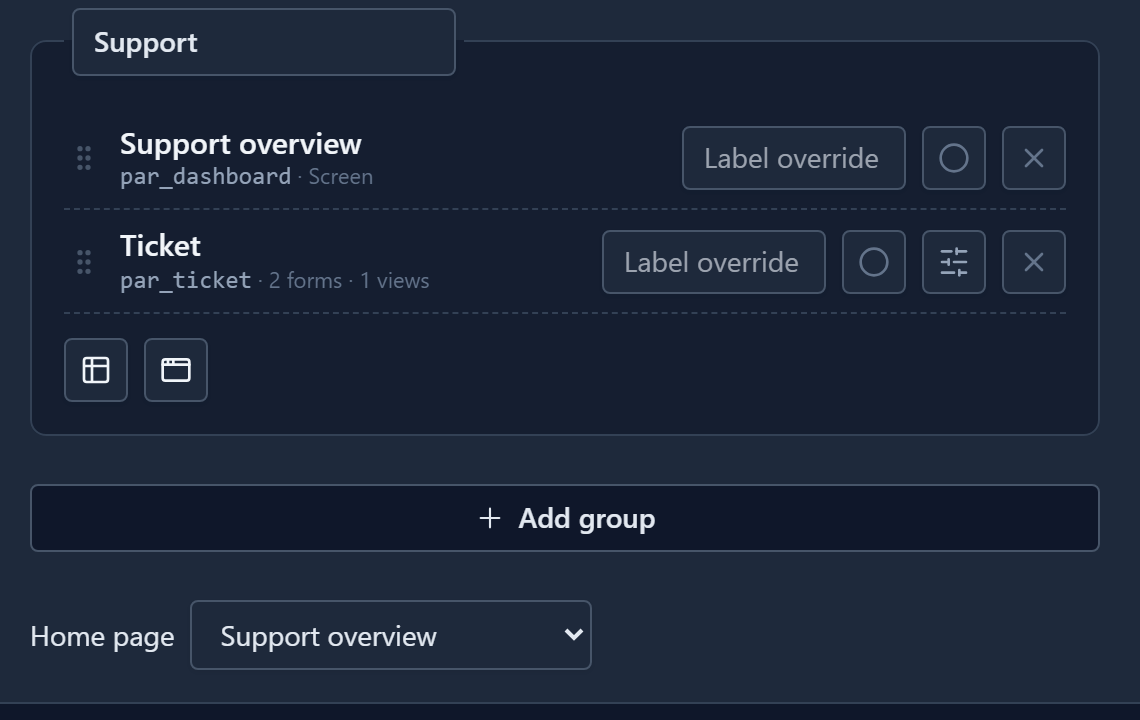
A screen nobody can reach isn't much use. Open your solution's Apps, create or edit an app, and in a navigation group press the screen button (the window glyph, beside the table button). We made a Support desk app with the screen and the Ticket table, and chose the screen as the Home page:
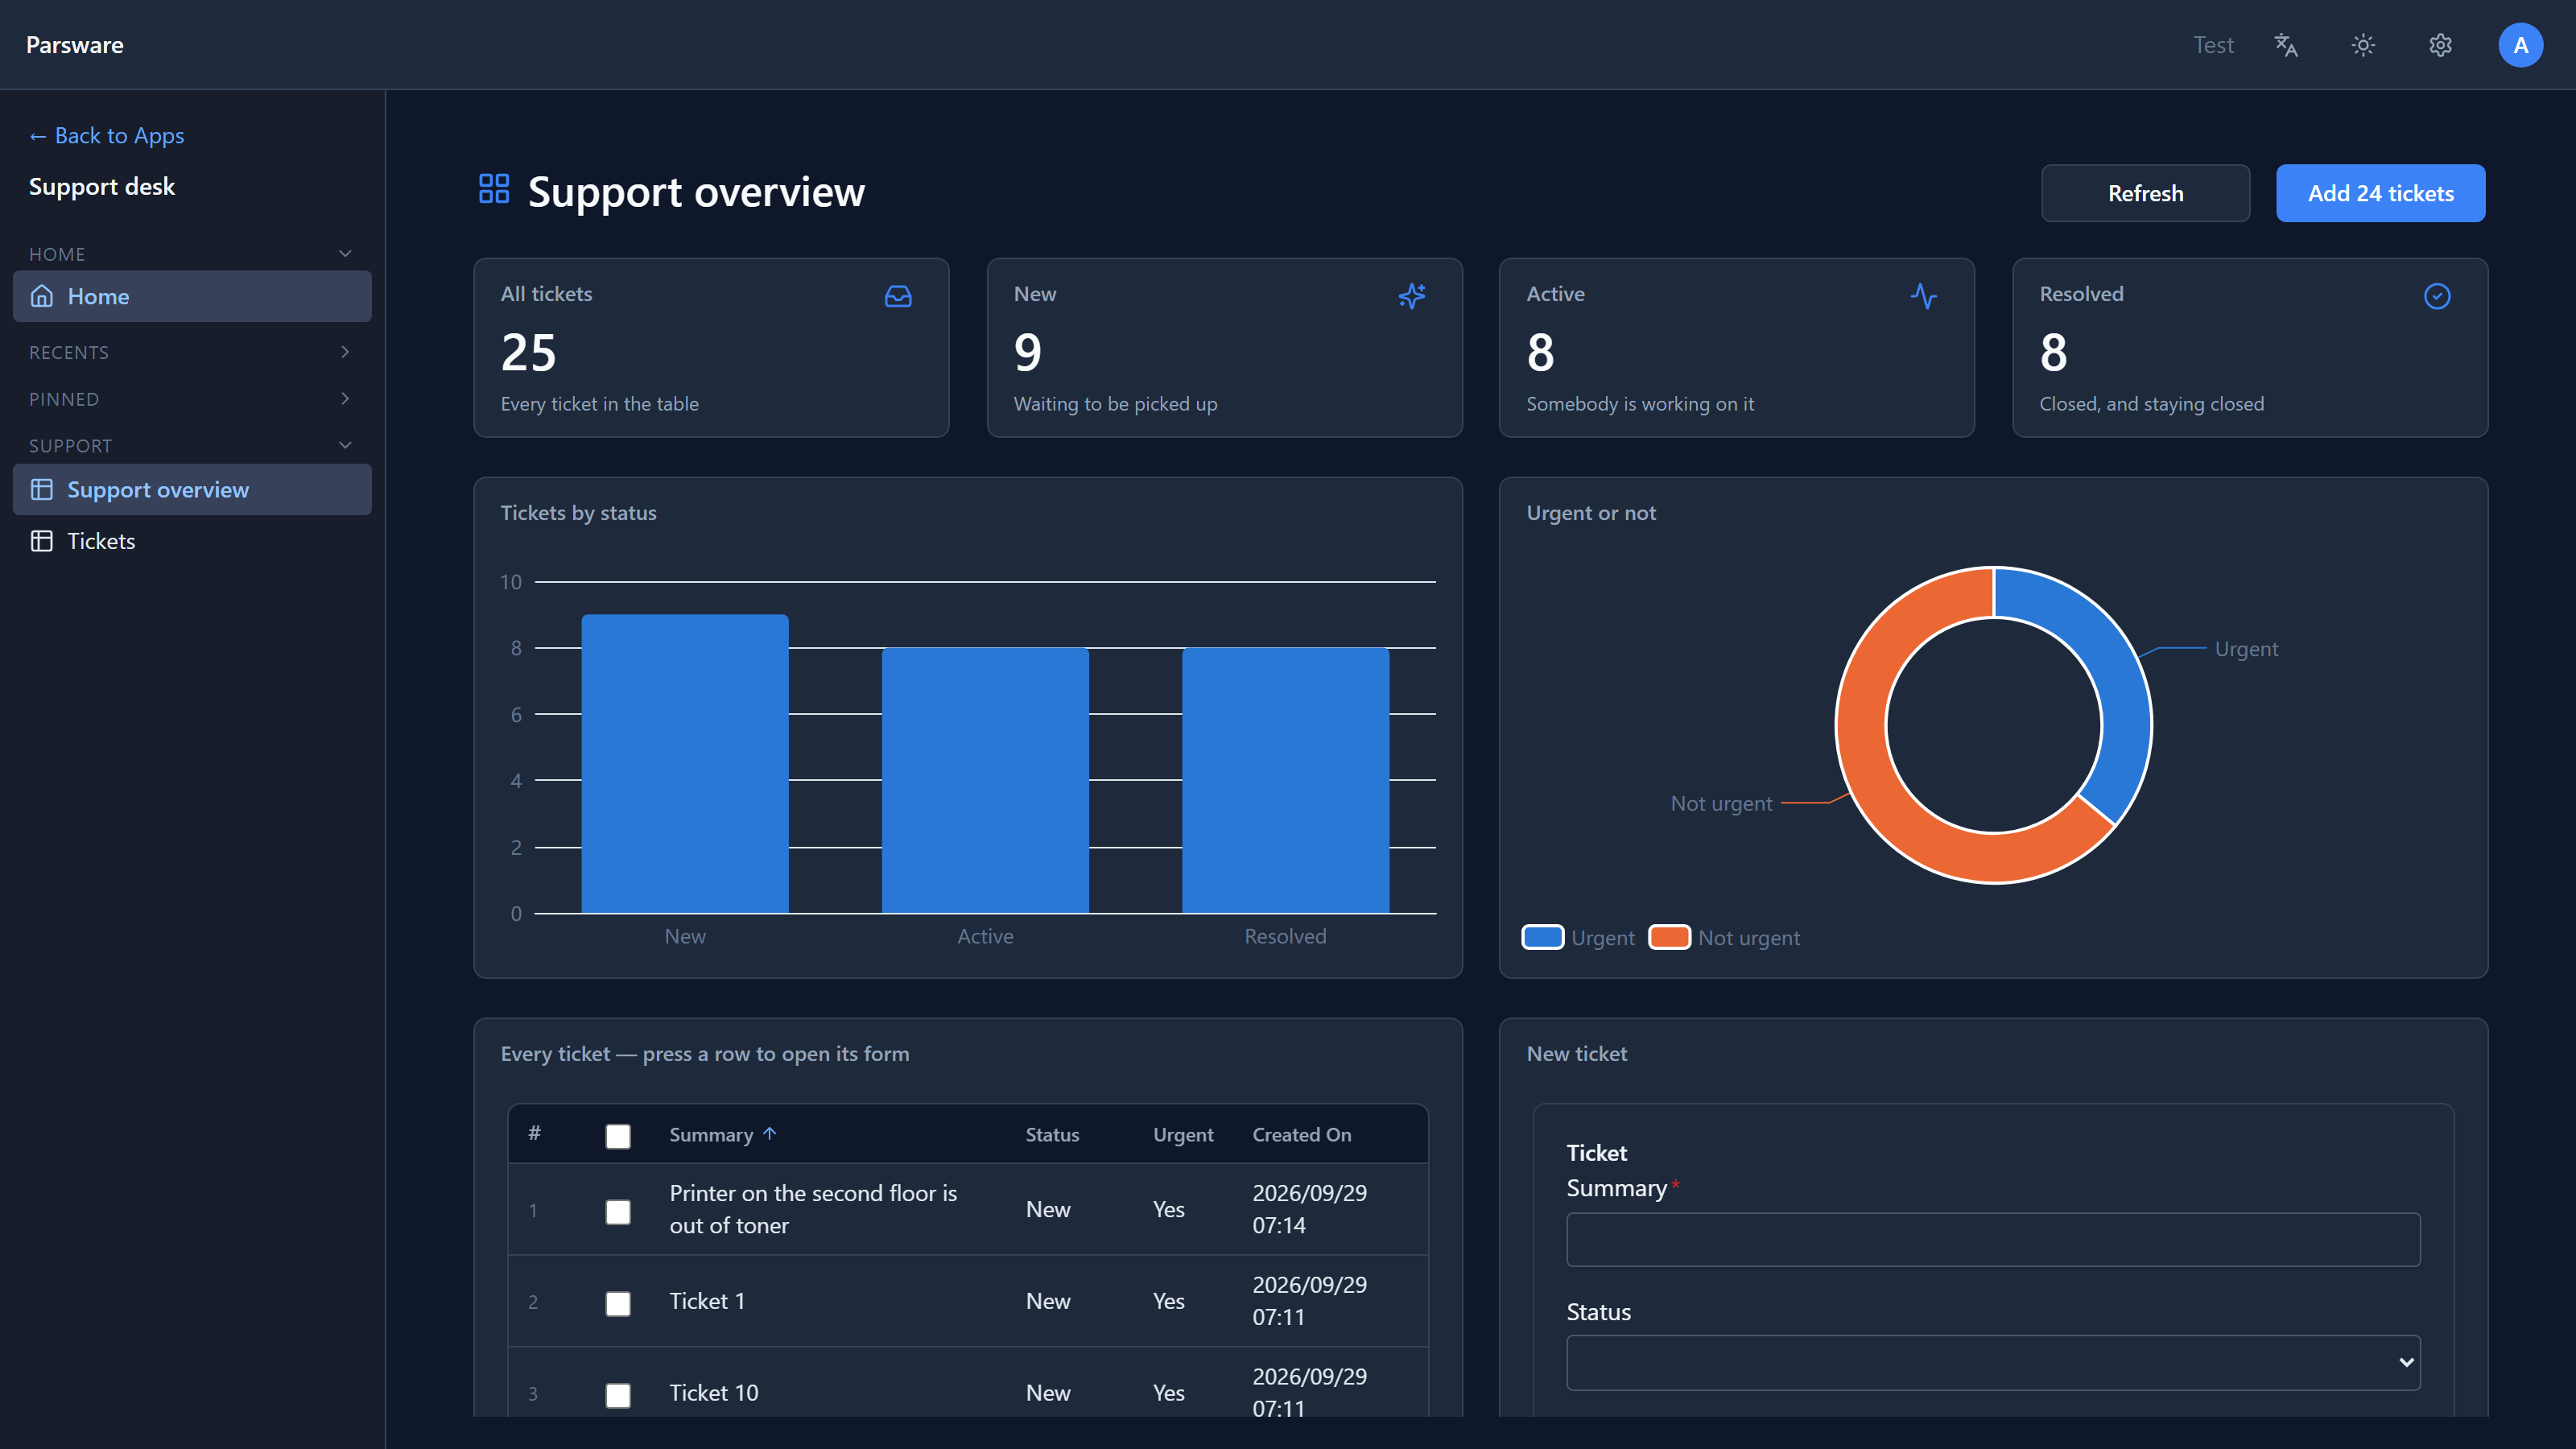
Open the app and it starts on the numbers, with the full list one click away in the rail:
The screen and the app travel in their solutions like any other component, so exporting to test and production takes the dashboard with it.
Next: show who created or changed a record.