For Power Apps
Parsware reports and Power BI paginated reports
Power BI paginated reports and Parsware reports both produce a document laid out to the page, and both can read Dataverse. They are built for different jobs. Here is where each one fits, what each costs to read, and when you would use both.
Este artículo solo está disponible en inglés.
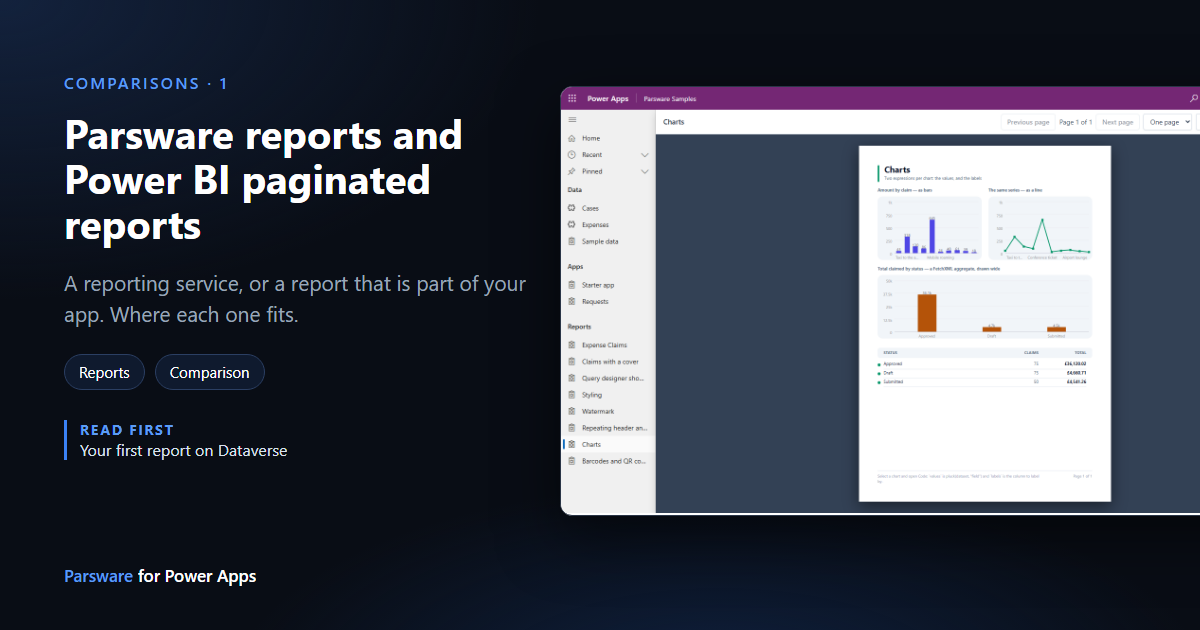
If you need a printed document from Dataverse, such as an invoice, a claim form or a statement, Microsoft's answer is a Power BI paginated report. Parsware for Power Apps has its own reports. Both produce pages laid out exactly, and both can read Dataverse, so it's a fair question which one to use.
The short answer: paginated reports are a reporting service. A Parsware report is part of your app. This article explains what that difference means in practice, so you can pick the right one for each job, or use both.
What each one is
A Power BI paginated report is an .rdl file, the format SQL Server Reporting Services has used
for years. You design it in Power BI Report Builder, a free Windows desktop application, and
publish it to a workspace in the Power BI service. People open it there, in a Power BI app, or
through a link.
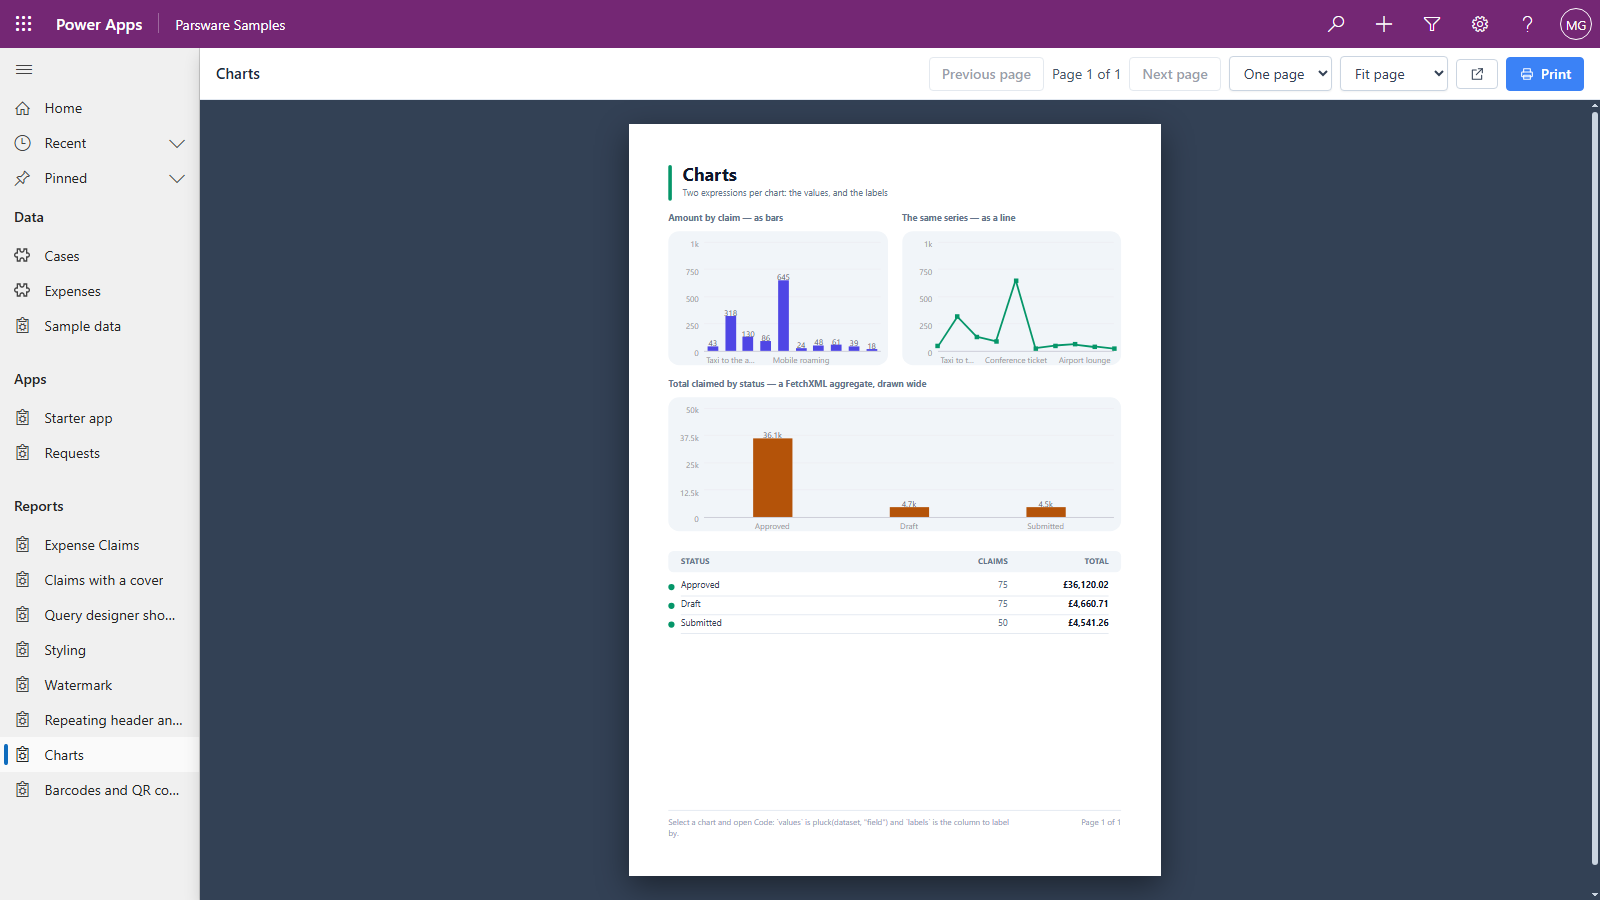
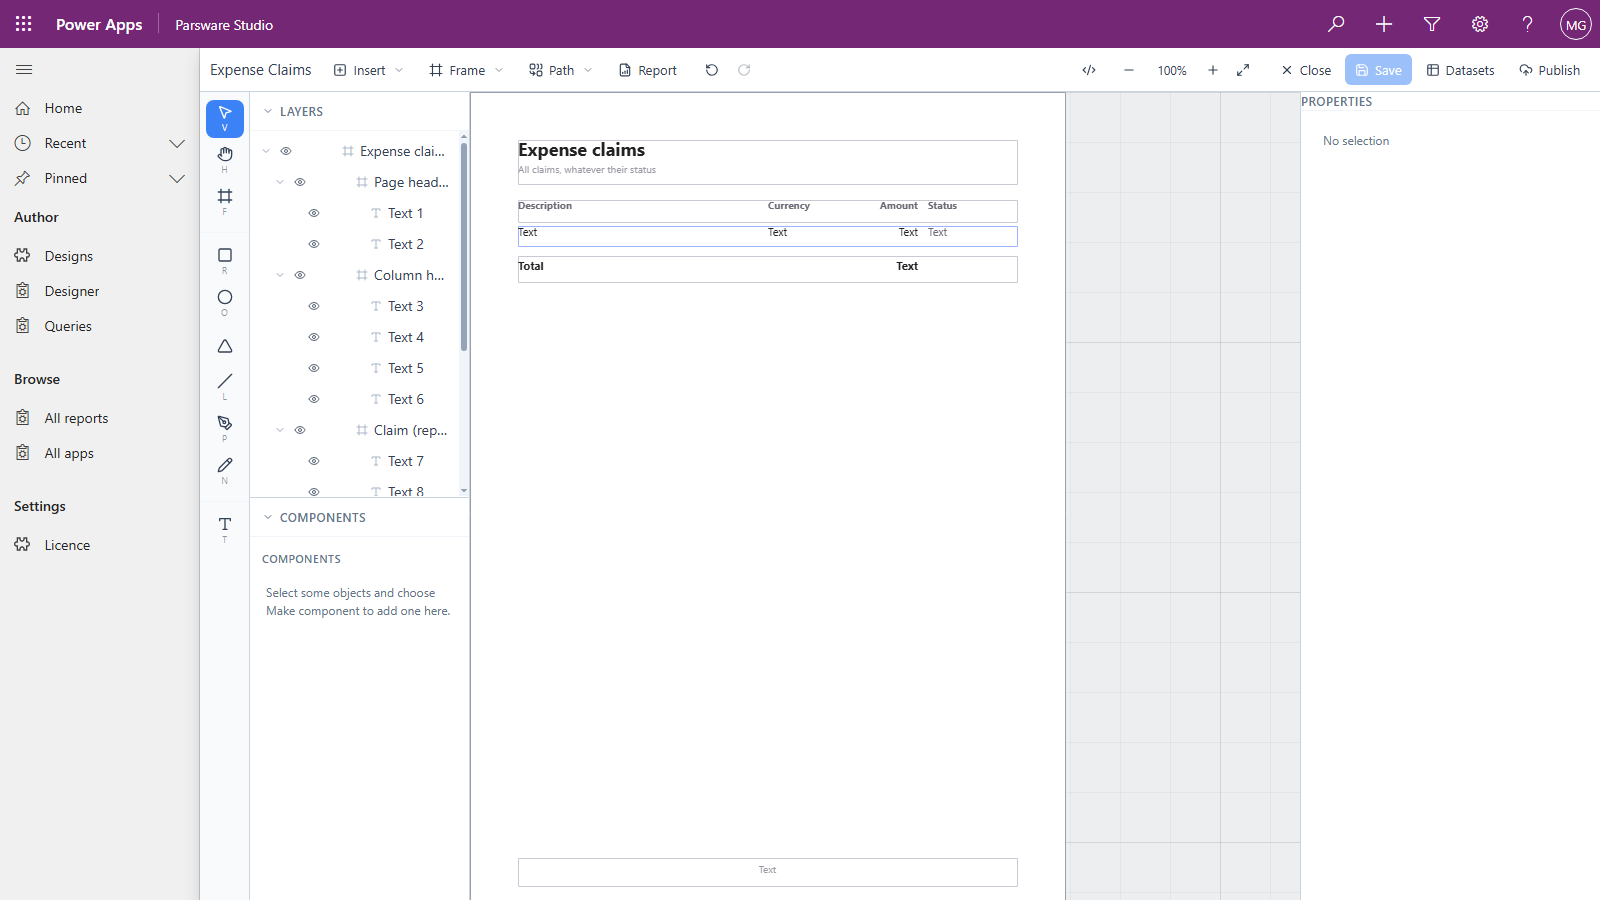
A Parsware report is a page you draw in the Parsware designer, which runs in the browser inside the Parsware Studio app in your development environment. You publish it into one of your own Dataverse solutions, and people open it in your model-driven app: from the navigation, or on a form.
Side by side
| Power BI paginated reports | Parsware reports | |
|---|---|---|
| Designed in | Power BI Report Builder, on Windows | The Parsware designer, in the browser, inside Power Apps |
| Lives in | A Power BI workspace | Your Dataverse solution, as a web resource |
| Moves between environments | With Power BI's own tools, separately from your app | With your solution, in the same export and import as your forms and views |
| Data | Dataverse, SQL Server, Azure SQL, Oracle, Power BI semantic models and more | Dataverse only: a table, a view or a FetchXML query |
| On a model-driven form | Not a documented option for paginated reports | A form control, showing the open record |
| Output | Print, PDF, Excel, Word, PowerPoint, CSV, XML and more | Print, and PDF through the browser's print dialog |
| Delivery | Email subscriptions on a schedule | Opened by a person, when they need it |
| To read one | A Power BI Pro or Premium Per User licence, unless the workspace is on Fabric F64 or Premium P1 capacity or larger | The Power Apps licence your users already have |
The rows below explain the ones that usually decide it.
Where paginated reports fit better
Lots of data sources. A paginated report can read SQL Server, Oracle and other sources through a gateway, and combine them with Dataverse. A Parsware report reads Dataverse and nothing else.
Many output formats. If people need the report as an Excel workbook or a Word document they can edit, paginated reports export to both. Parsware prints, and saves a PDF from the print dialog.
Scheduled delivery. Paginated reports can be emailed on a schedule, such as a statement on the first of every month. Parsware has no scheduler: a person opens a report when they need it.
Existing reports. If you already have Reporting Services reports, they're .rdl files, and
Microsoft has tools to move them to Power BI. Parsware can't open them.
You already pay for Power BI. If every reader already has a Pro licence, or your workspaces are on a large enough capacity, the cost question below doesn't apply to you.
Where Parsware reports fit better
The report belongs to a record. A Parsware report sits on a model-driven form and shows the record you're looking at: the claim's own lines, the case's own summary. See A report on a form. Microsoft documents putting an ordinary Power BI report on a form by exporting the solution and editing the form's XML by hand. We didn't find a documented way to do it for a paginated report.
It moves with your app. A published Parsware design is a component of your own solution. When you export the solution from Dev and import it into Prod, the report goes with the forms and views that use it (Move designs from Dev to Prod). A paginated report lives in a Power BI workspace, so it has its own deployment, kept in step with your app by hand.
Readers need no extra licence. Parsware is priced per environment, with unlimited users. Anybody who can open your model-driven app can read its reports. To read a paginated report, each reader needs Power BI Pro or Premium Per User, unless the workspace runs on Fabric F64 or Premium P1 capacity or larger. For a few hundred people who only ever read an invoice, that difference is large.
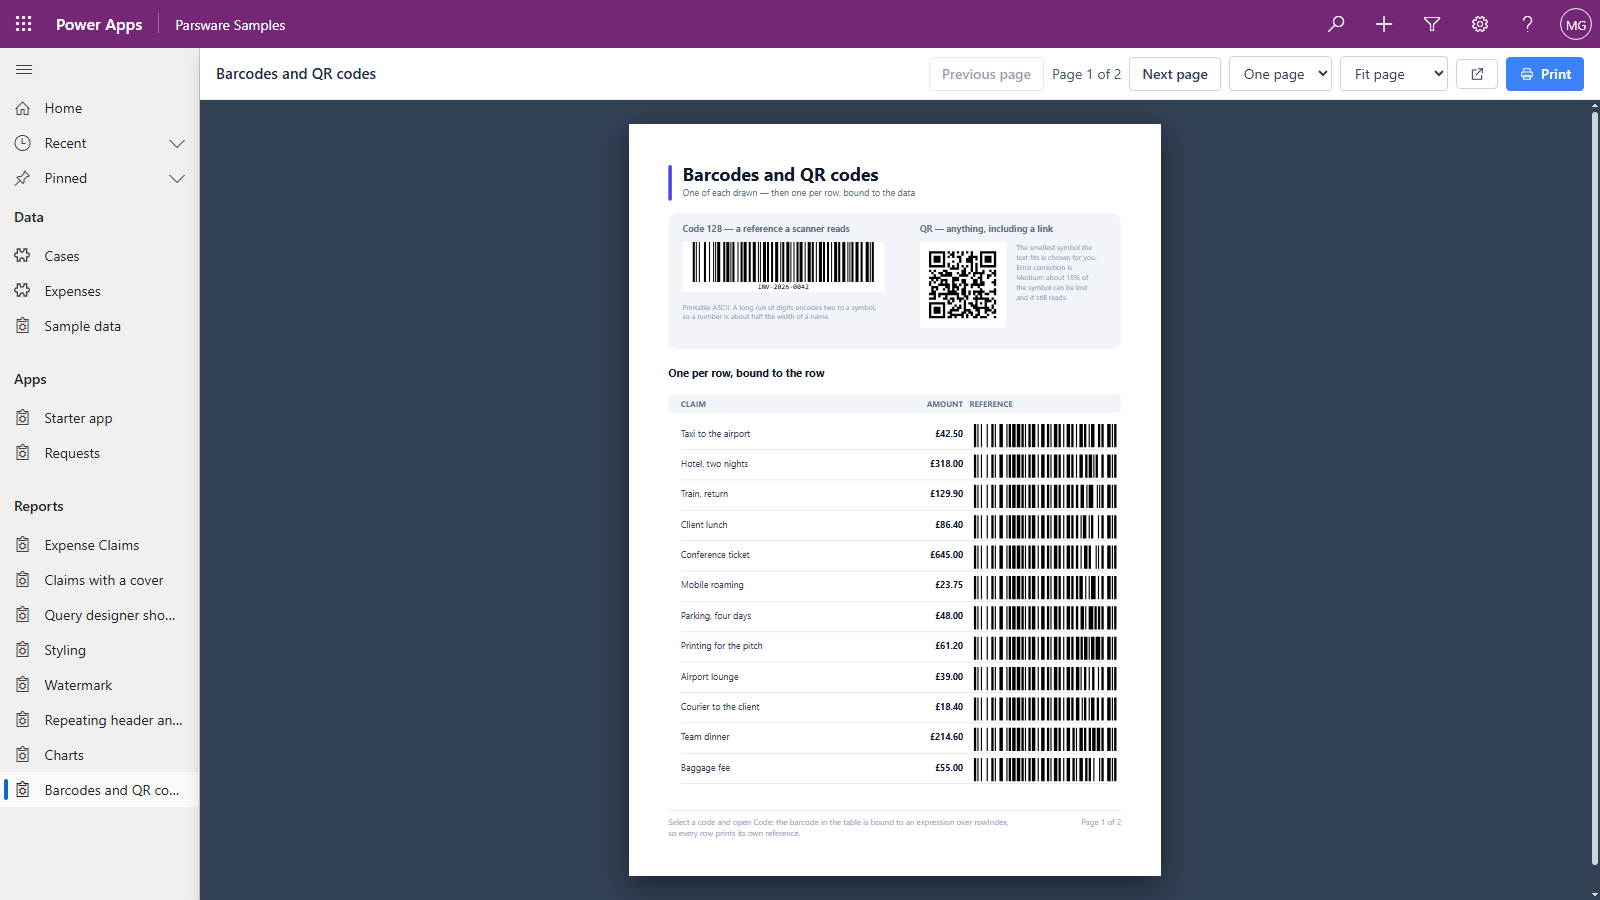
It's drawn, not built in a grid. You place text, tables, charts, images and barcodes exactly where you want them, by dragging, in the browser.
Nothing leaves Dataverse. A Parsware report reads rows in the browser through the Dataverse Web API, as the signed-in user, so security roles apply exactly as they do in the rest of the app. There's no second service holding a copy of the report or a connection to your data (What stays on your tenant). A paginated report runs in the Power BI service, which has its own settings, permissions and capacity to manage.
One designer for reports and screens. The same designer draws Studio screens, the interactive panels that go on forms, so makers learn one tool.
What it costs to read
Prices change, so check Microsoft's own pages before deciding. At the time of writing:
- Power BI. Designing a paginated report is free. Publishing it to a shared workspace needs Power BI Pro, $14 per user per month, or Premium Per User, $24. Every reader needs one of those too, unless the workspace is on Fabric F64 or Premium P1 capacity or larger, where readers with a free licence can view it.
- Parsware for Power Apps. Reports are in the Standard plan: $299 for three environments, with no limit on makers or readers. A yearly renewal buys updates and support; what you bought keeps working without it. See pricing.
Using both
They don't compete for the same space. A common split:
- Power BI paginated reports for scheduled, high-volume output and anything that combines Dataverse with other systems: month-end statements, a nightly export, a report across your ERP and Dataverse.
- Parsware reports for documents people open from inside the app, on a record, at the moment they need them: the invoice for this order, the claim form for this expense, the sheet for this case.
And for exploring data, with slicers, cross-filtering and dashboards, neither of these is the tool. That's what ordinary Power BI reports are for.
Next
Studio screens and canvas apps: drawing a screen for a form versus building a canvas app. The whole series is in the reading list.