For Power Apps
Parsware for Power Apps: an overview
Parsware for Power Apps is a managed Dataverse solution that adds two things to model-driven apps. Reports laid out to the pixel and bound to your tables, and screens you draw and place on a form. It runs entirely inside your tenant, and your data never leaves it.
Dit artikel is alleen in het Engels beschikbaar.
Model-driven apps are good at tables, forms and views. They are less good at two things people ask for all the time:
- A document that has to look exactly right. An expense claim, an invoice, a certificate, a delivery note: something with a layout, a logo, totals in the right place, and pages that print the way they look on screen.
- A part of a form that isn't a field. A row of buttons that fill in a value, a checklist, a panel that changes as the record changes.
Parsware for Power Apps adds both, inside the model-driven apps you already have. It is a managed Dataverse solution: you import it like any other, and it runs in your environment, against your tables, as your users.
This article is the tour. The rest of the series shows each part step by step.
What you get
Reports on your Dataverse tables
A Parsware report is a page you draw: text, lines, images, tables, charts, barcodes, placed exactly where you want them, on the paper size you choose. You bind it to your data by naming a table, a view, or a pasted FetchXML query, and the report fills itself from the rows.
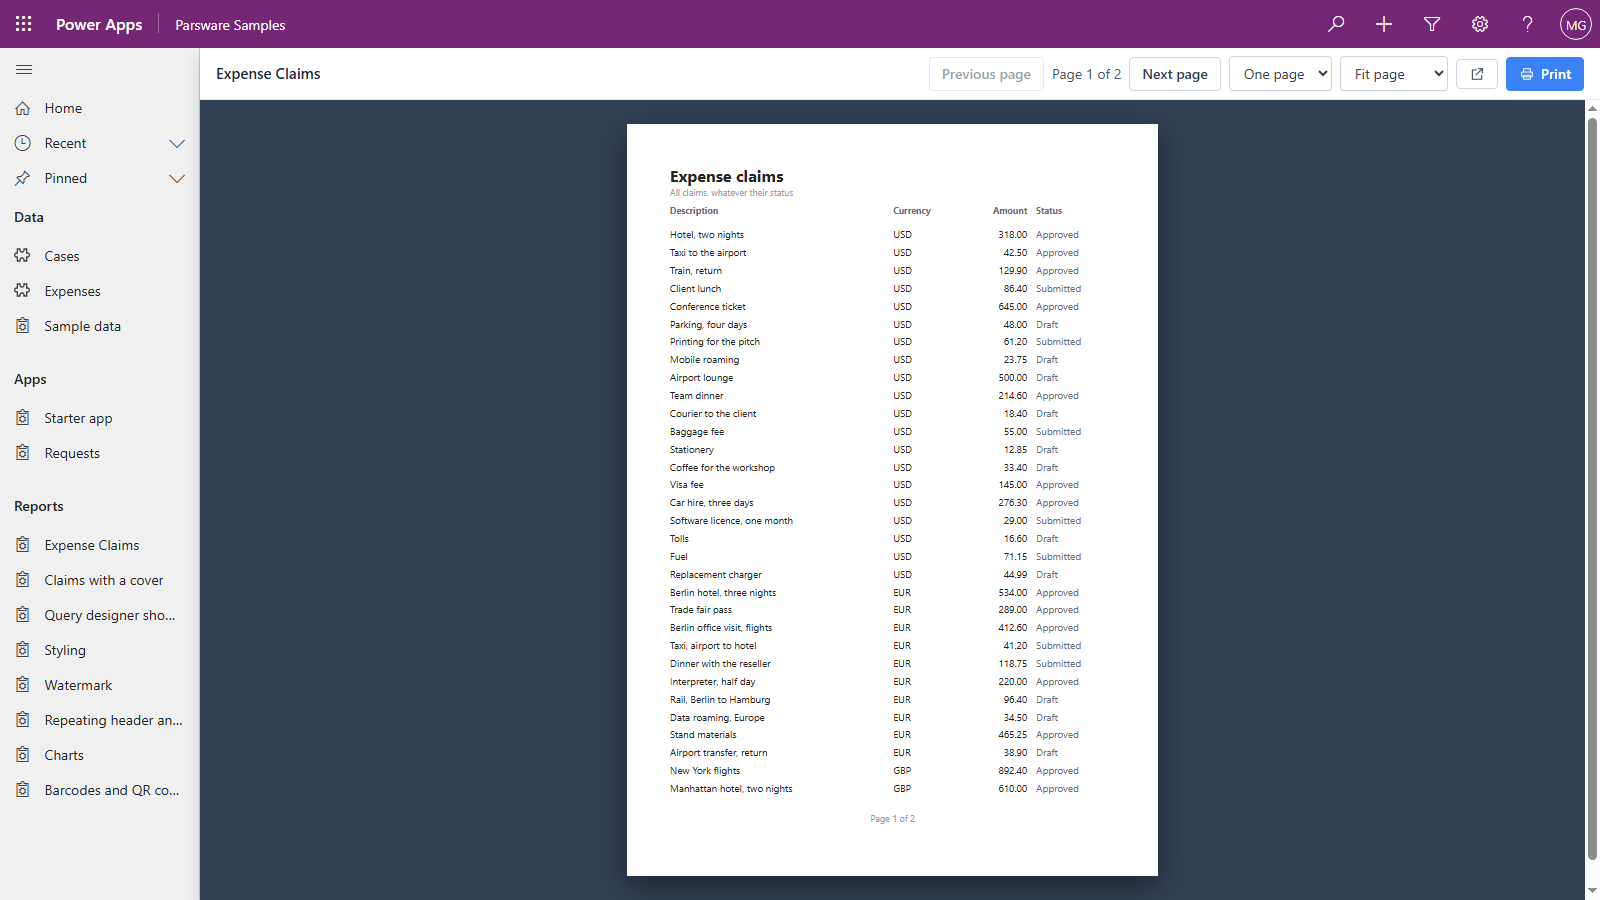
A few things that matter in practice:
- Lookups and choices come out as their labels, not as ids or option numbers.
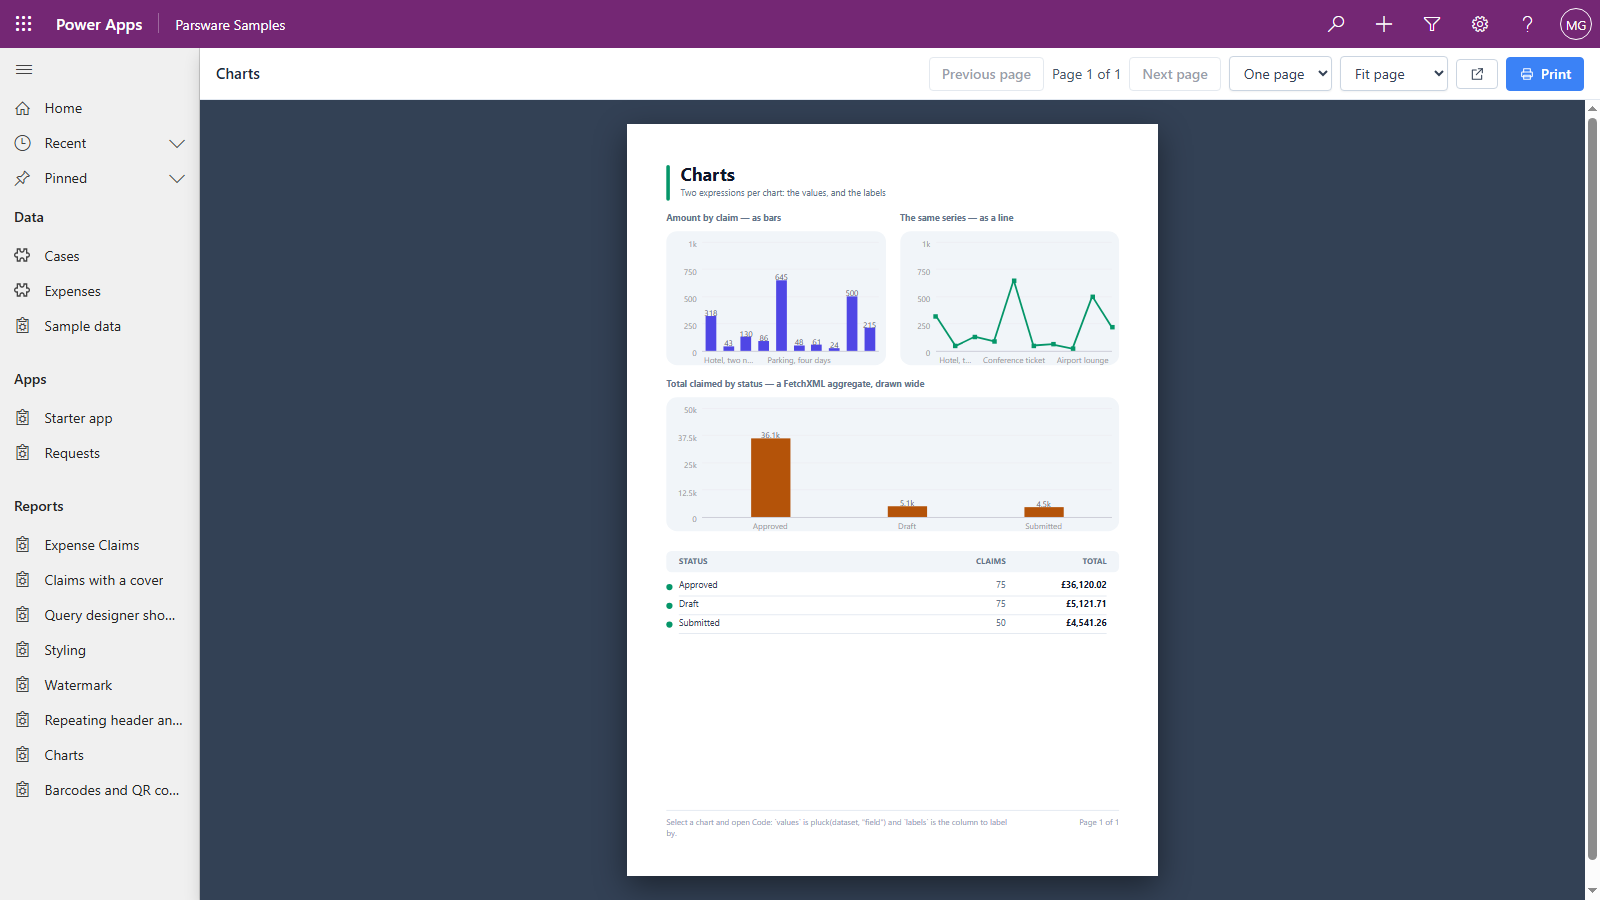
- Totals can come from FetchXML aggregates, so a sum over thousands of rows is computed by Dataverse, not by the page.
- Printing is one to one. The report sets the paper size itself, so a page prints as one sheet with no browser headers in the margin.
- A report can sit on a form, narrowed to the record you are looking at: the claim's own lines, the order's own items.
Charts are part of the same drawing, not a separate tool:
Studio screens on your forms
A Studio screen is also something you draw, but it is interactive: buttons, lists, text that changes, several screens with navigation between them. You place it on a model-driven form in one of two ways:
- As a form section, beside your Dataverse fields. It can read the record and open dialogs and side panes.
- As a field, where it draws that column itself and writes the value back when someone presses a button. One control can read and write several columns.
Here are both on one expense record. The Currency field is a drawn control: its top row of buttons writes the currency, its bottom row writes the amount. Below it, Approval checklist is a drawn screen sitting in a form section.
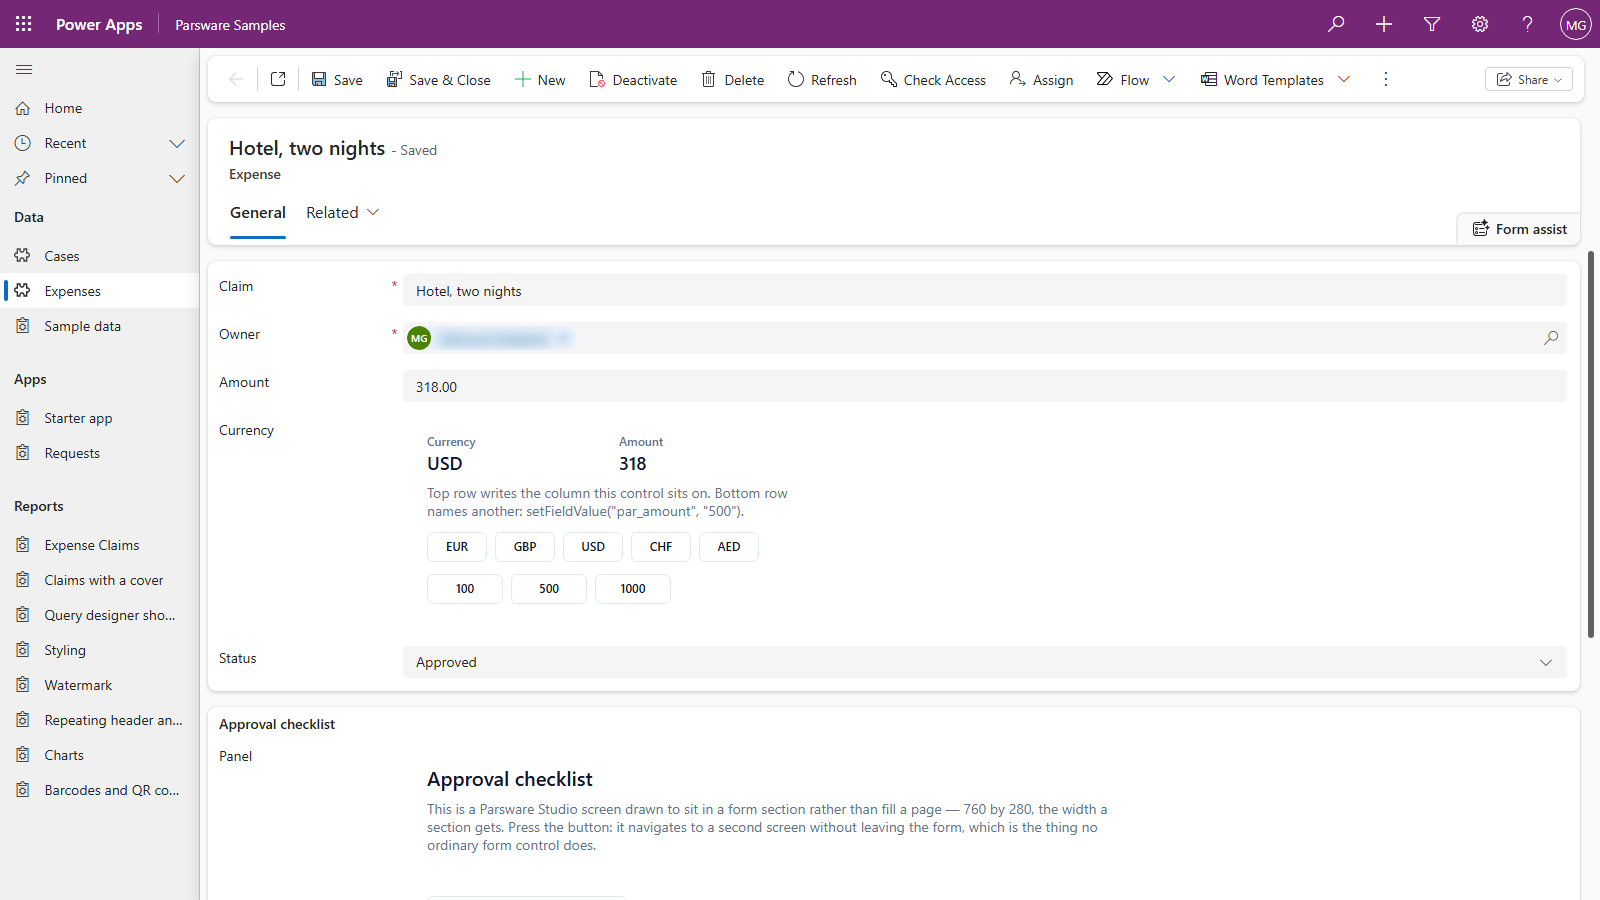
Everything else on that form is ordinary Power Apps: the same command bar, the same Save, the same security. A drawn control writes its value into the form rather than saving it itself, so the record is saved when the form is, the way it would be if somebody had typed it.
Screens can also be whole pages in an app's navigation, reading lists of real rows from your tables, with scripts behind their buttons.
One designer for both
Reports and screens are drawn in the same designer, which opens inside the Parsware Studio app in your development environment:
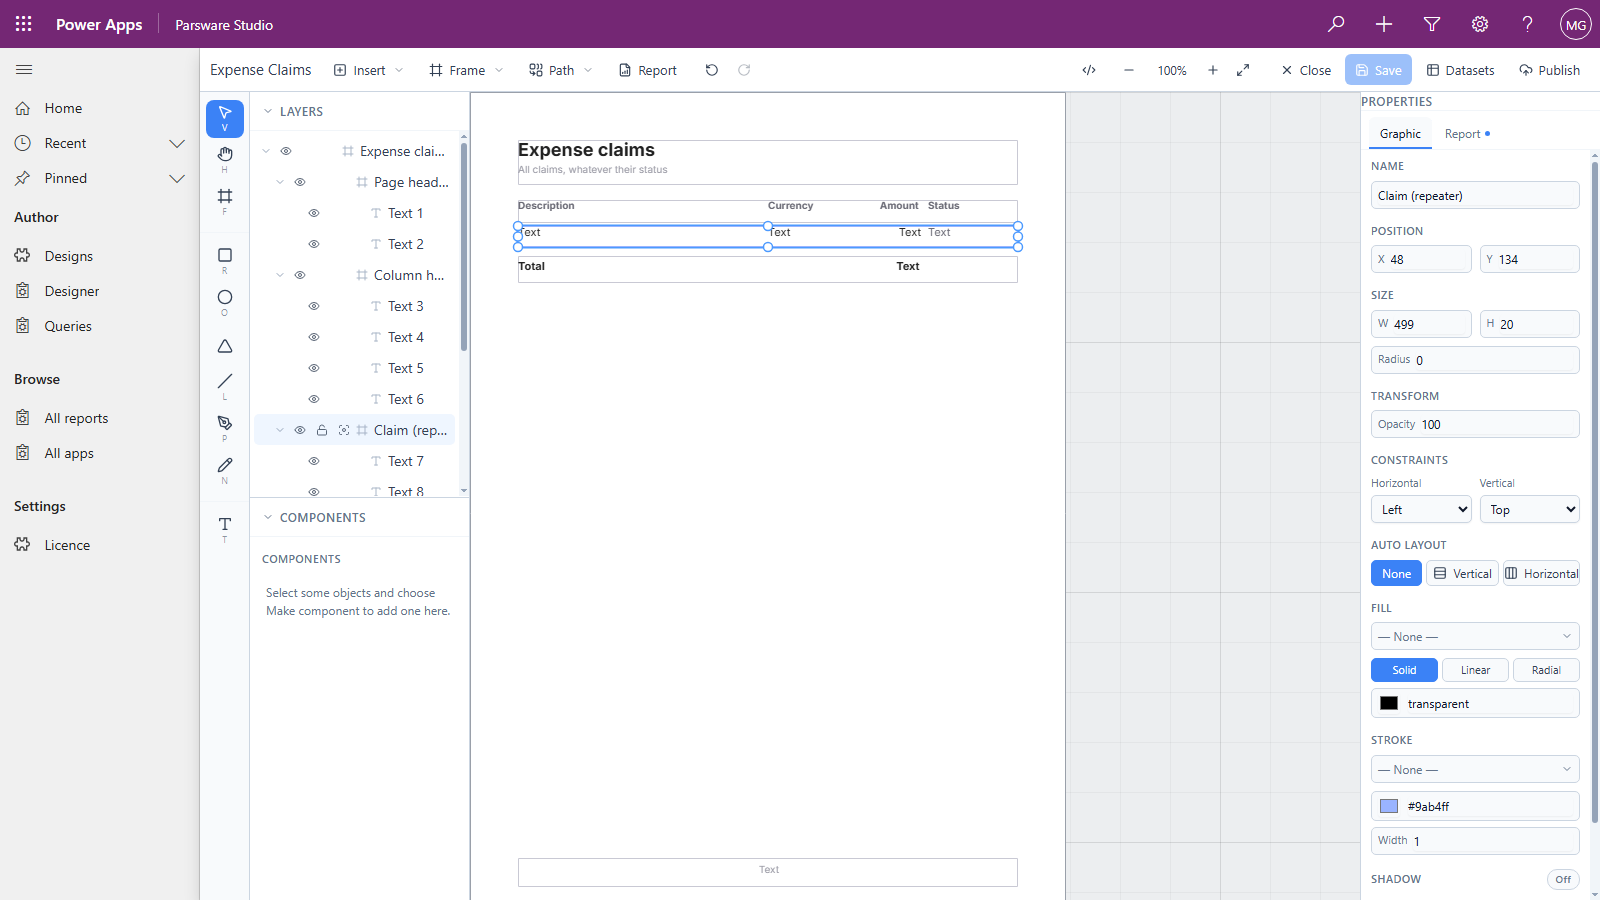
The pickers in it read your Dataverse metadata. When you bind a report or a screen, you choose from your own tables, columns and views, not from names you type and hope are right.
How it fits into Power Apps
It installs as three managed solutions:
| Solution | What it holds | Where it goes |
|---|---|---|
| Parsware Runtime | What shows reports and screens: the form controls, the page that renders a design, the licence check, and the Parsware app | Every environment, production included |
| Parsware Studio | The designer, and the Parsware Studio app makers work in | Development environments only |
| Parsware Samples | Two small tables, ten finished designs and an app that opens them | Optional, and never production |
The work follows one loop: draw, publish, place.
- Draw a report or a screen in the designer, in development.
- Publish it into one of your own solutions. Publishing is a separate step from saving, so a half-finished draft never reaches anybody; users only ever see what was published.
- Place it: a leaf in an app's navigation, a section on a form, or a control on a column.
Because a published design is a component in your solution, it moves from development to test to production the way the rest of your app does: export, import, the usual pipeline. Production needs only the runtime.
What never leaves your tenant
Every part of the product runs from your Dataverse environment. The pages are web resources, the form controls are code components, and the licence check is a plug-in.
- Your data stays in Dataverse. Reports and screens read rows through the Dataverse Web API, in the browser, as the signed-in user, so security roles apply exactly as they do to the rest of the app. There is no Parsware server in between, and nothing is copied out.
- The licence is checked inside your tenant. A licence key is a signed line of text you paste in once. A plug-in verifies the signature against a public key built into it, without calling us. A tenant with no route to the internet runs the product the same way as one with a route.
Who it's for
- Teams already on Power Apps who need printed or PDF-quality documents from their data and don't want a second reporting system to run.
- Makers who've run out of form controls and need something on a form the standard controls don't do.
- Organisations that can't let data leave the tenant, for policy or for regulation.
It isn't a replacement for Power BI's analytics, and a Studio screen isn't a canvas app. The comparisons at the end of this series say where each one fits.
Next
Install it: the three solutions, in order, and which environment gets which. Or go back to the reading list for the whole series.