For Power Apps
Totals with FetchXML
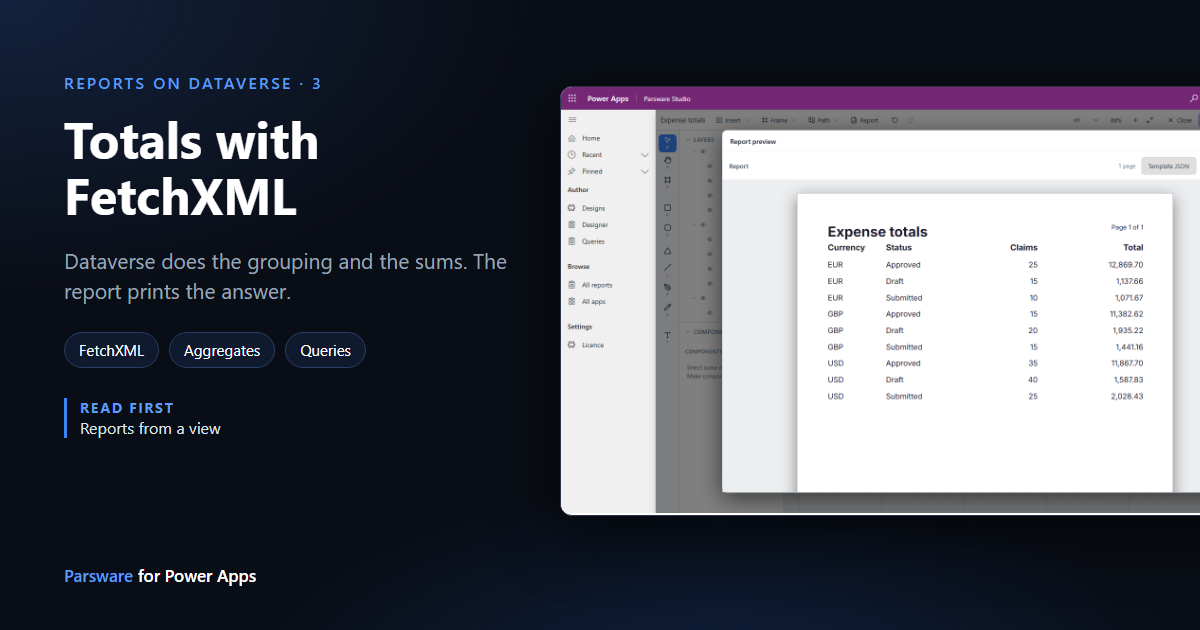
A view returns rows and can't add them up. For totals, counts and averages by group, a Parsware report reads a FetchXML aggregate, so Dataverse does the arithmetic and the report prints the answer. Here's a table of expense totals by currency and status, from one pasted query.
Dieser Artikel ist nur auf Englisch verfügbar.
Views decide which rows a report reads, but a view can only return
rows. It can't say "the total per currency" or "how many claims in each status". Those are
aggregates, and in Dataverse the way to ask for one is FetchXML:
aggregate="true", a groupby on the columns you group by, and sum, count, avg, min or
max on the ones you add up.
A Parsware report can take its rows from a FetchXML query pasted whole. Dataverse runs the aggregate, so a total over thousands of rows is computed where the data is, and the report receives a handful of grouped rows ready to print.
We'll build a table of the samples' expense claims, grouped by currency and status, with a count and a total for each group.
1. Write the query, and run it first
Open Queries in Parsware Studio and press New query. Give it a name, open the FetchXML tab and write the query:
<fetch aggregate="true">
  <entity name="par_expense">
    <attribute name="par_currency" groupby="true" alias="currency" />
    <attribute name="par_status" groupby="true" alias="status" />
    <attribute name="par_expenseid" aggregate="count" alias="claims" />
    <attribute name="par_amount" aggregate="sum" alias="total" />
    <order alias="currency" />
    <order alias="status" />
  </entity>
</fetch>
Press Preview. The page runs the query against your environment and shows what came back:
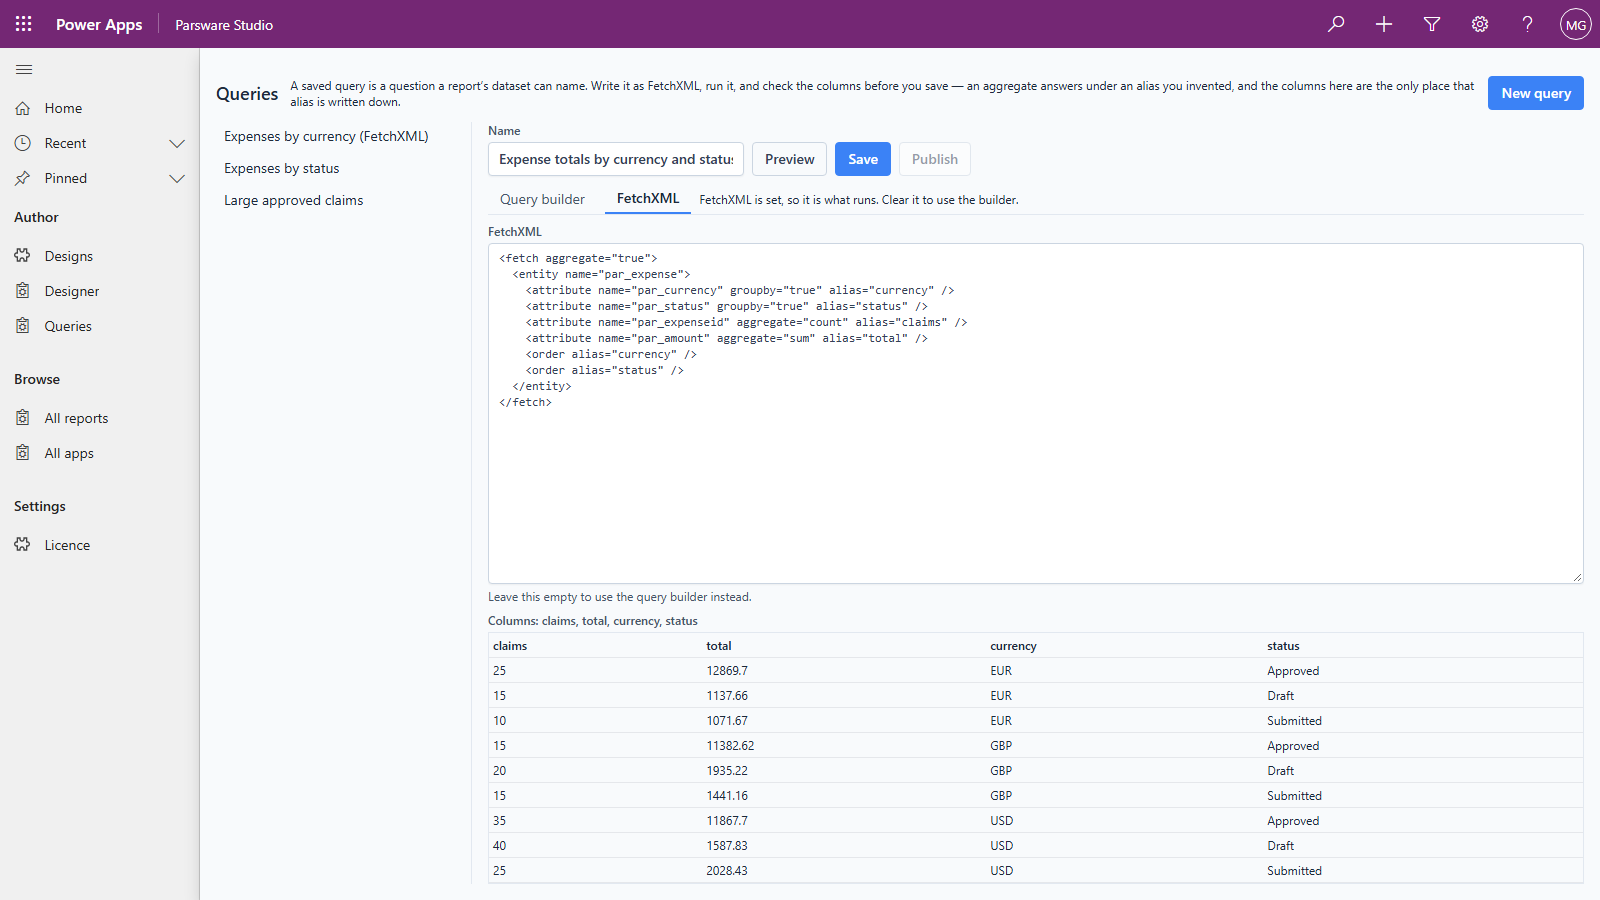
The line above the table matters more than the table. An aggregate answers under the alias you
gave it, claims and total here, and those names appear in no column list anywhere. The preview
is where you see them written down, and they're what the report will bind to.
Notice too that status came back as words, Approved, Draft and Submitted. Grouping by a choice column returns its label, not the number Dataverse stores.
Press Save to keep the query. You can come back to it here, change it and preview it again.
2. Paste it into the design
Create a report design as before (ours is Expense totals) and add a report page. Then open the design's own row: in Designs, open Expense totals. The Datasets field there holds the report's datasets as JSON. Paste the query into it as one dataset:
[
  {
    "name": "totals",
    "fetchXml": "<fetch aggregate=\"true\"><entity name=\"par_expense\">…</entity></fetch>"
  }
]
The whole query goes in fetchXml, as one string, with its double quotes escaped. There's no
table: the query's <entity> already says which table, so the report reads it from there.
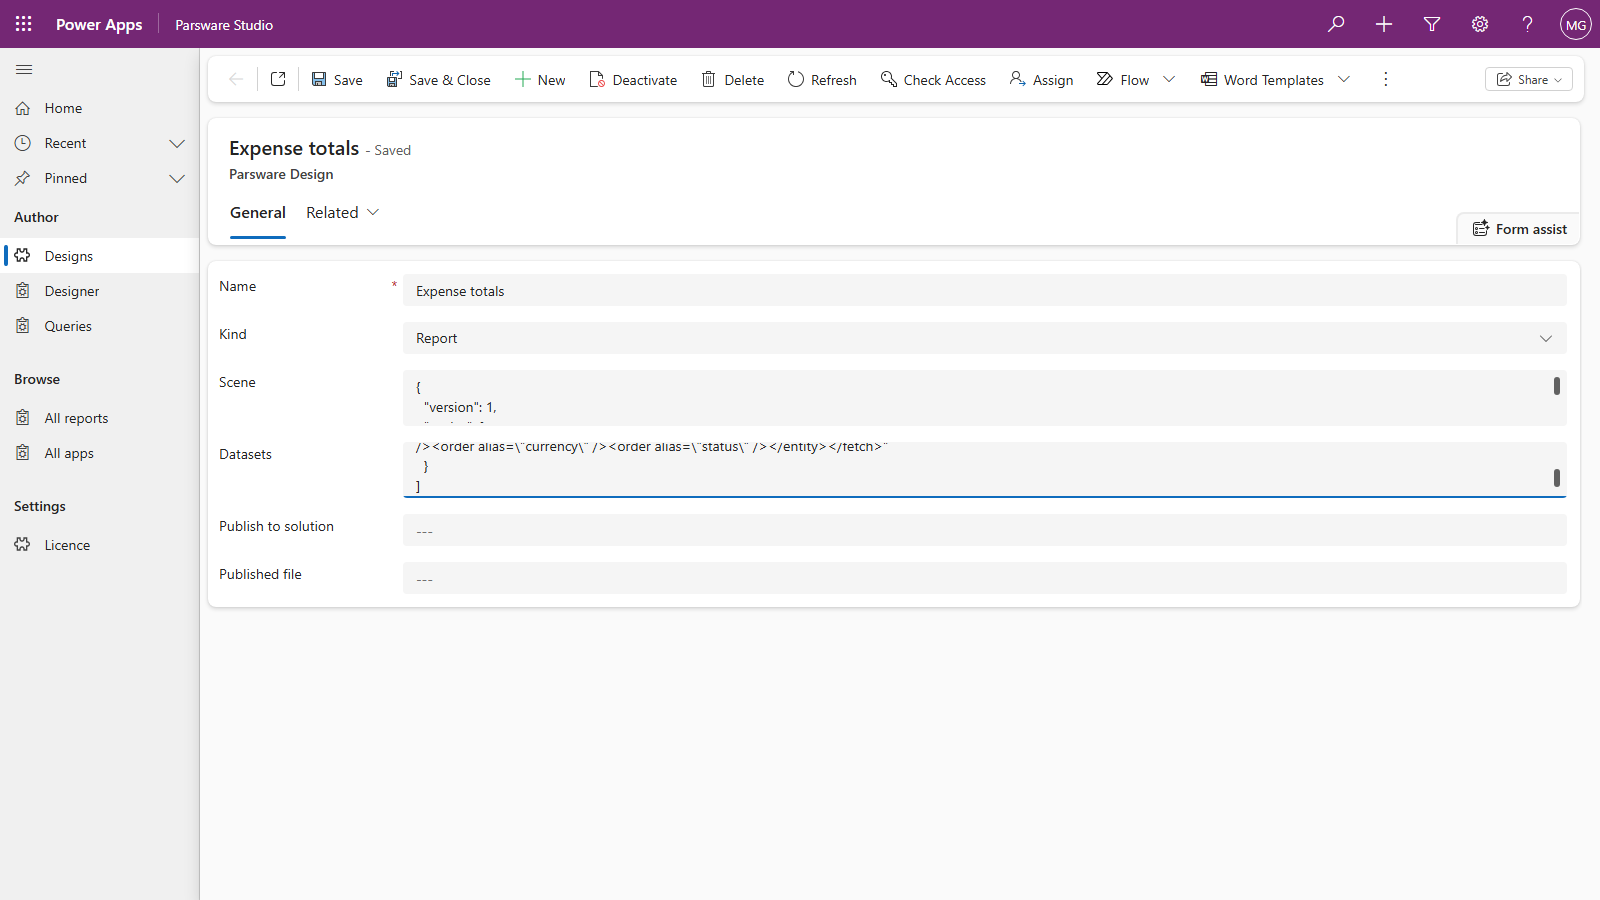
Save the form. Back in the designer, Datasets now lists totals as a dataset that uses pasted
FetchXML, and leaves it alone: a picker can't express an aggregate, so the dialog never offers to
replace it.
3. Bind to the aliases
Set the repeater's Repeat over to totals. Open any Binding list inside it and the choices
are exactly the query's aliases: currency, status, claims and total.
The report page's row has two text boxes, and we need four. Select one, press Ctrl+D to duplicate it, then set its X, W and Y in the Graphic tab. The copy lands slightly below the original, so set Y back to the original's. Then bind each box:
| Box | Binding | Format |
|---|---|---|
| Currency | currency |
text |
| Status | status |
text |
| Claims | claims |
integer |
| Total | total |
number |
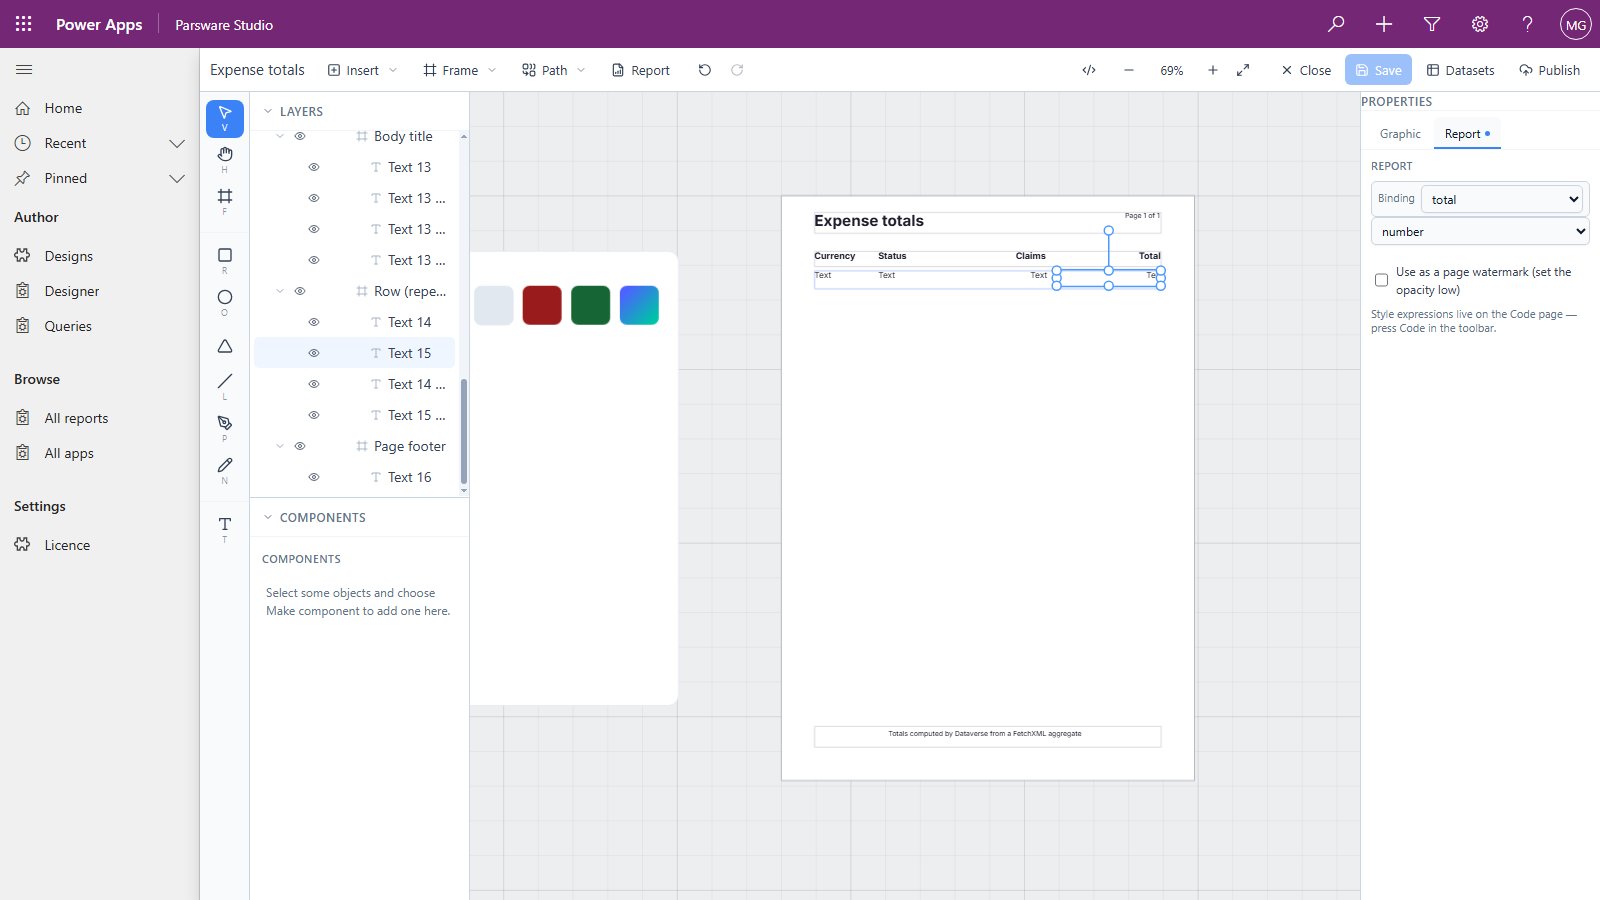
Why number and not currency for the total? The currency format prints in your organisation's base currency, and these totals are in three different currencies. That's also why the query groups by currency: adding euros to pounds would give a number that means nothing.
Headings go in the body title the same way: duplicate, move, retype.
4. Preview
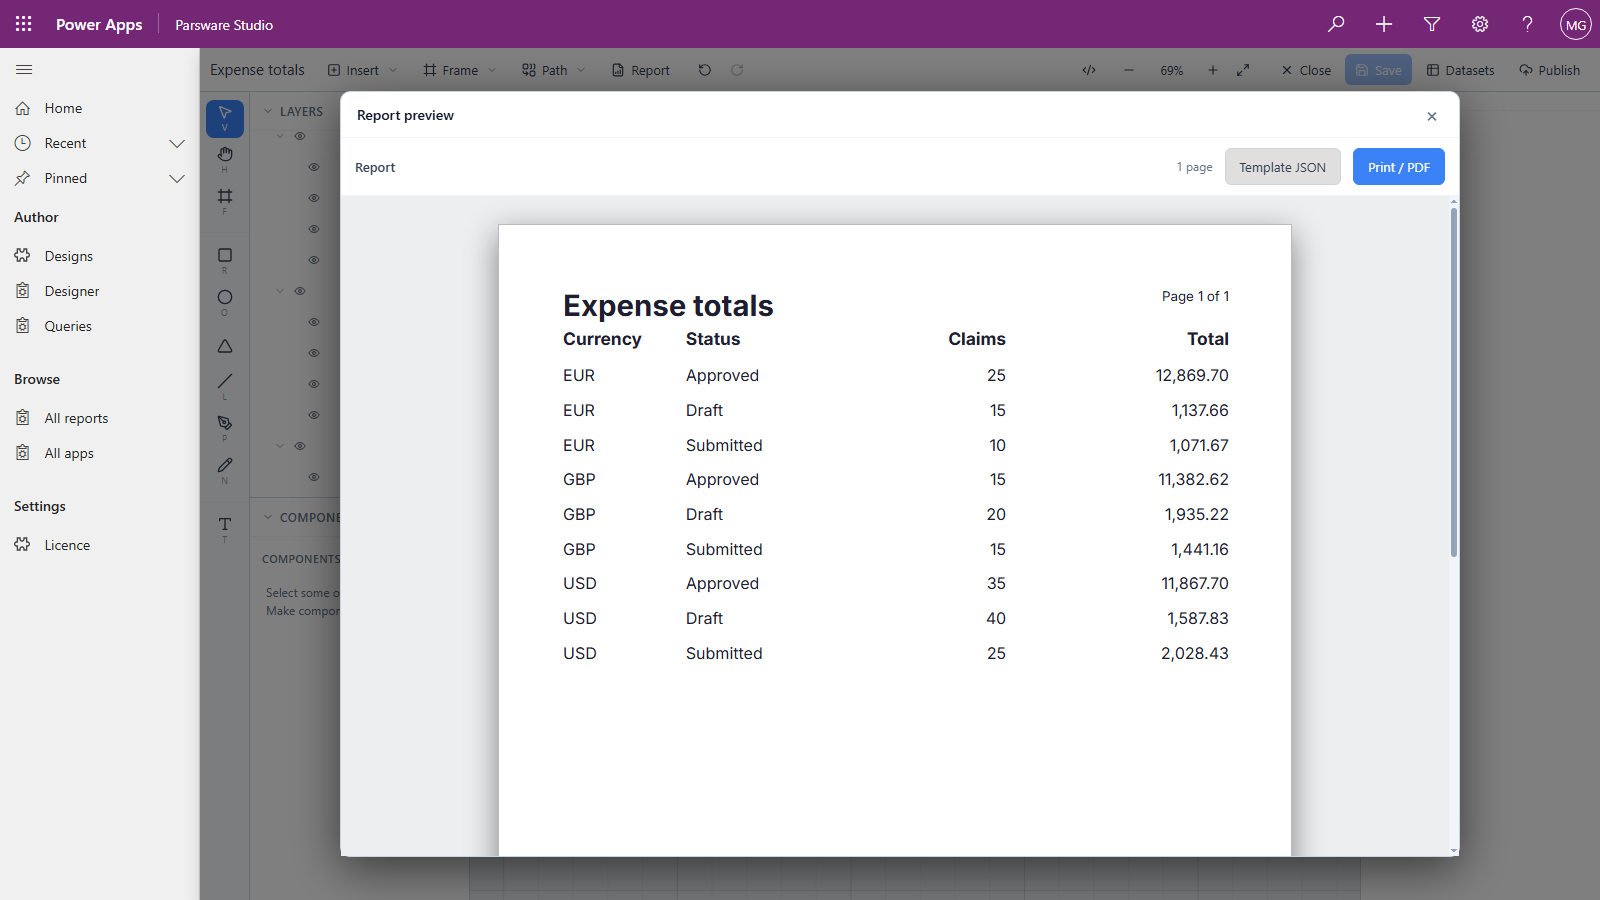
Nine rows from 200 claims, and the report added up none of them. Dataverse did the grouping, counting and summing, and the report laid out the answer.
The samples' data is deliberately uneven, and you can see it here. Approved claims carry most of the money, while Draft claims are the most numerous in USD. That's the difference between a total and a count, and it's why a report wants both.
Good to know
- A view or FetchXML, never both, in one dataset. A dataset naming both is refused, with its name in the message.
- The query's own
count/topapply, and the report's 500-row cap doesn't. - Dataverse limits aggregates to 50,000 matching rows. Over that, the query fails with
AggregateQueryRecordLimit exceeded. Add a filter to the query to narrow it. - The Datasets field is ordinary text. A mistake in the JSON or the query stops the report rendering with a message that names the dataset, rather than printing a quietly empty page.
Next
Lookups and choices in a report: printing the record a lookup points at, and a choice's label rather than its number. The whole series is in the reading list.